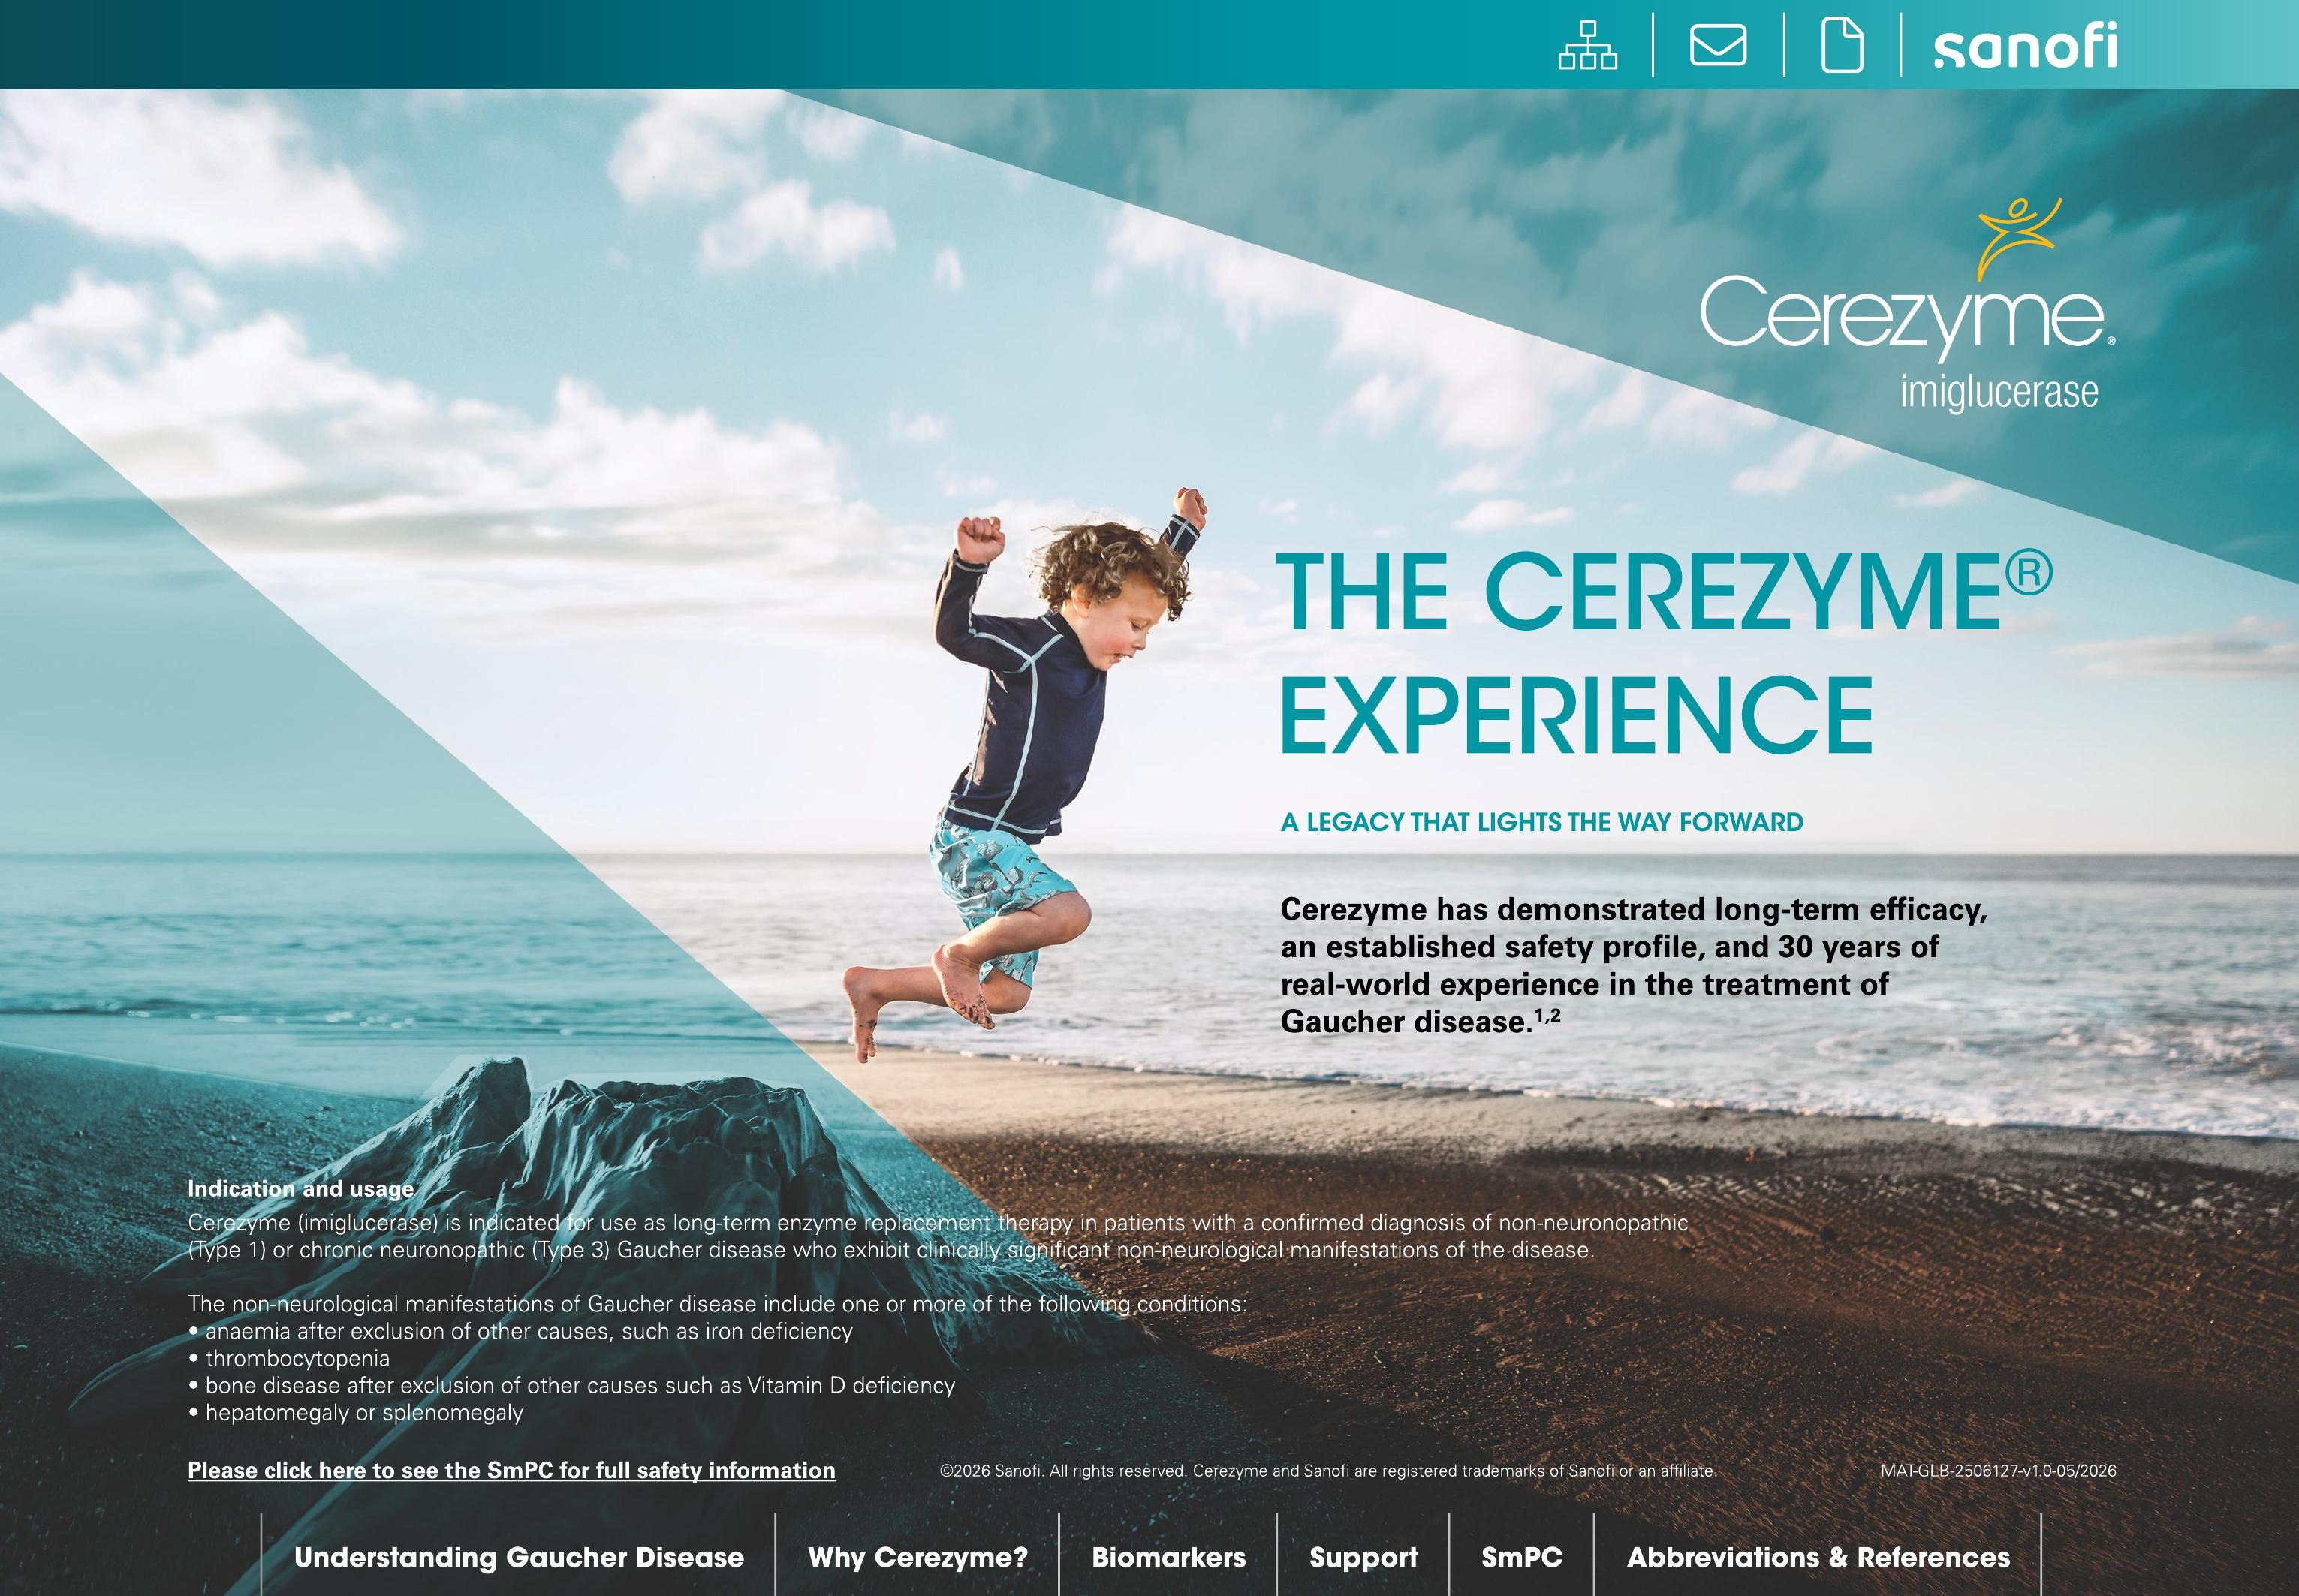
The Big Idea
An interactive visual aid, or iVA, is what a rep opens on an iPad to walk a physician through the clinical story behind a drug. This one covers Cerezyme's full case in Gaucher disease: disease burden, biomarkers, and 30 years of treatment outcomes across patient types. The old version was a PDF. It scrolled top to bottom whether the physician cared about pediatric data or not.
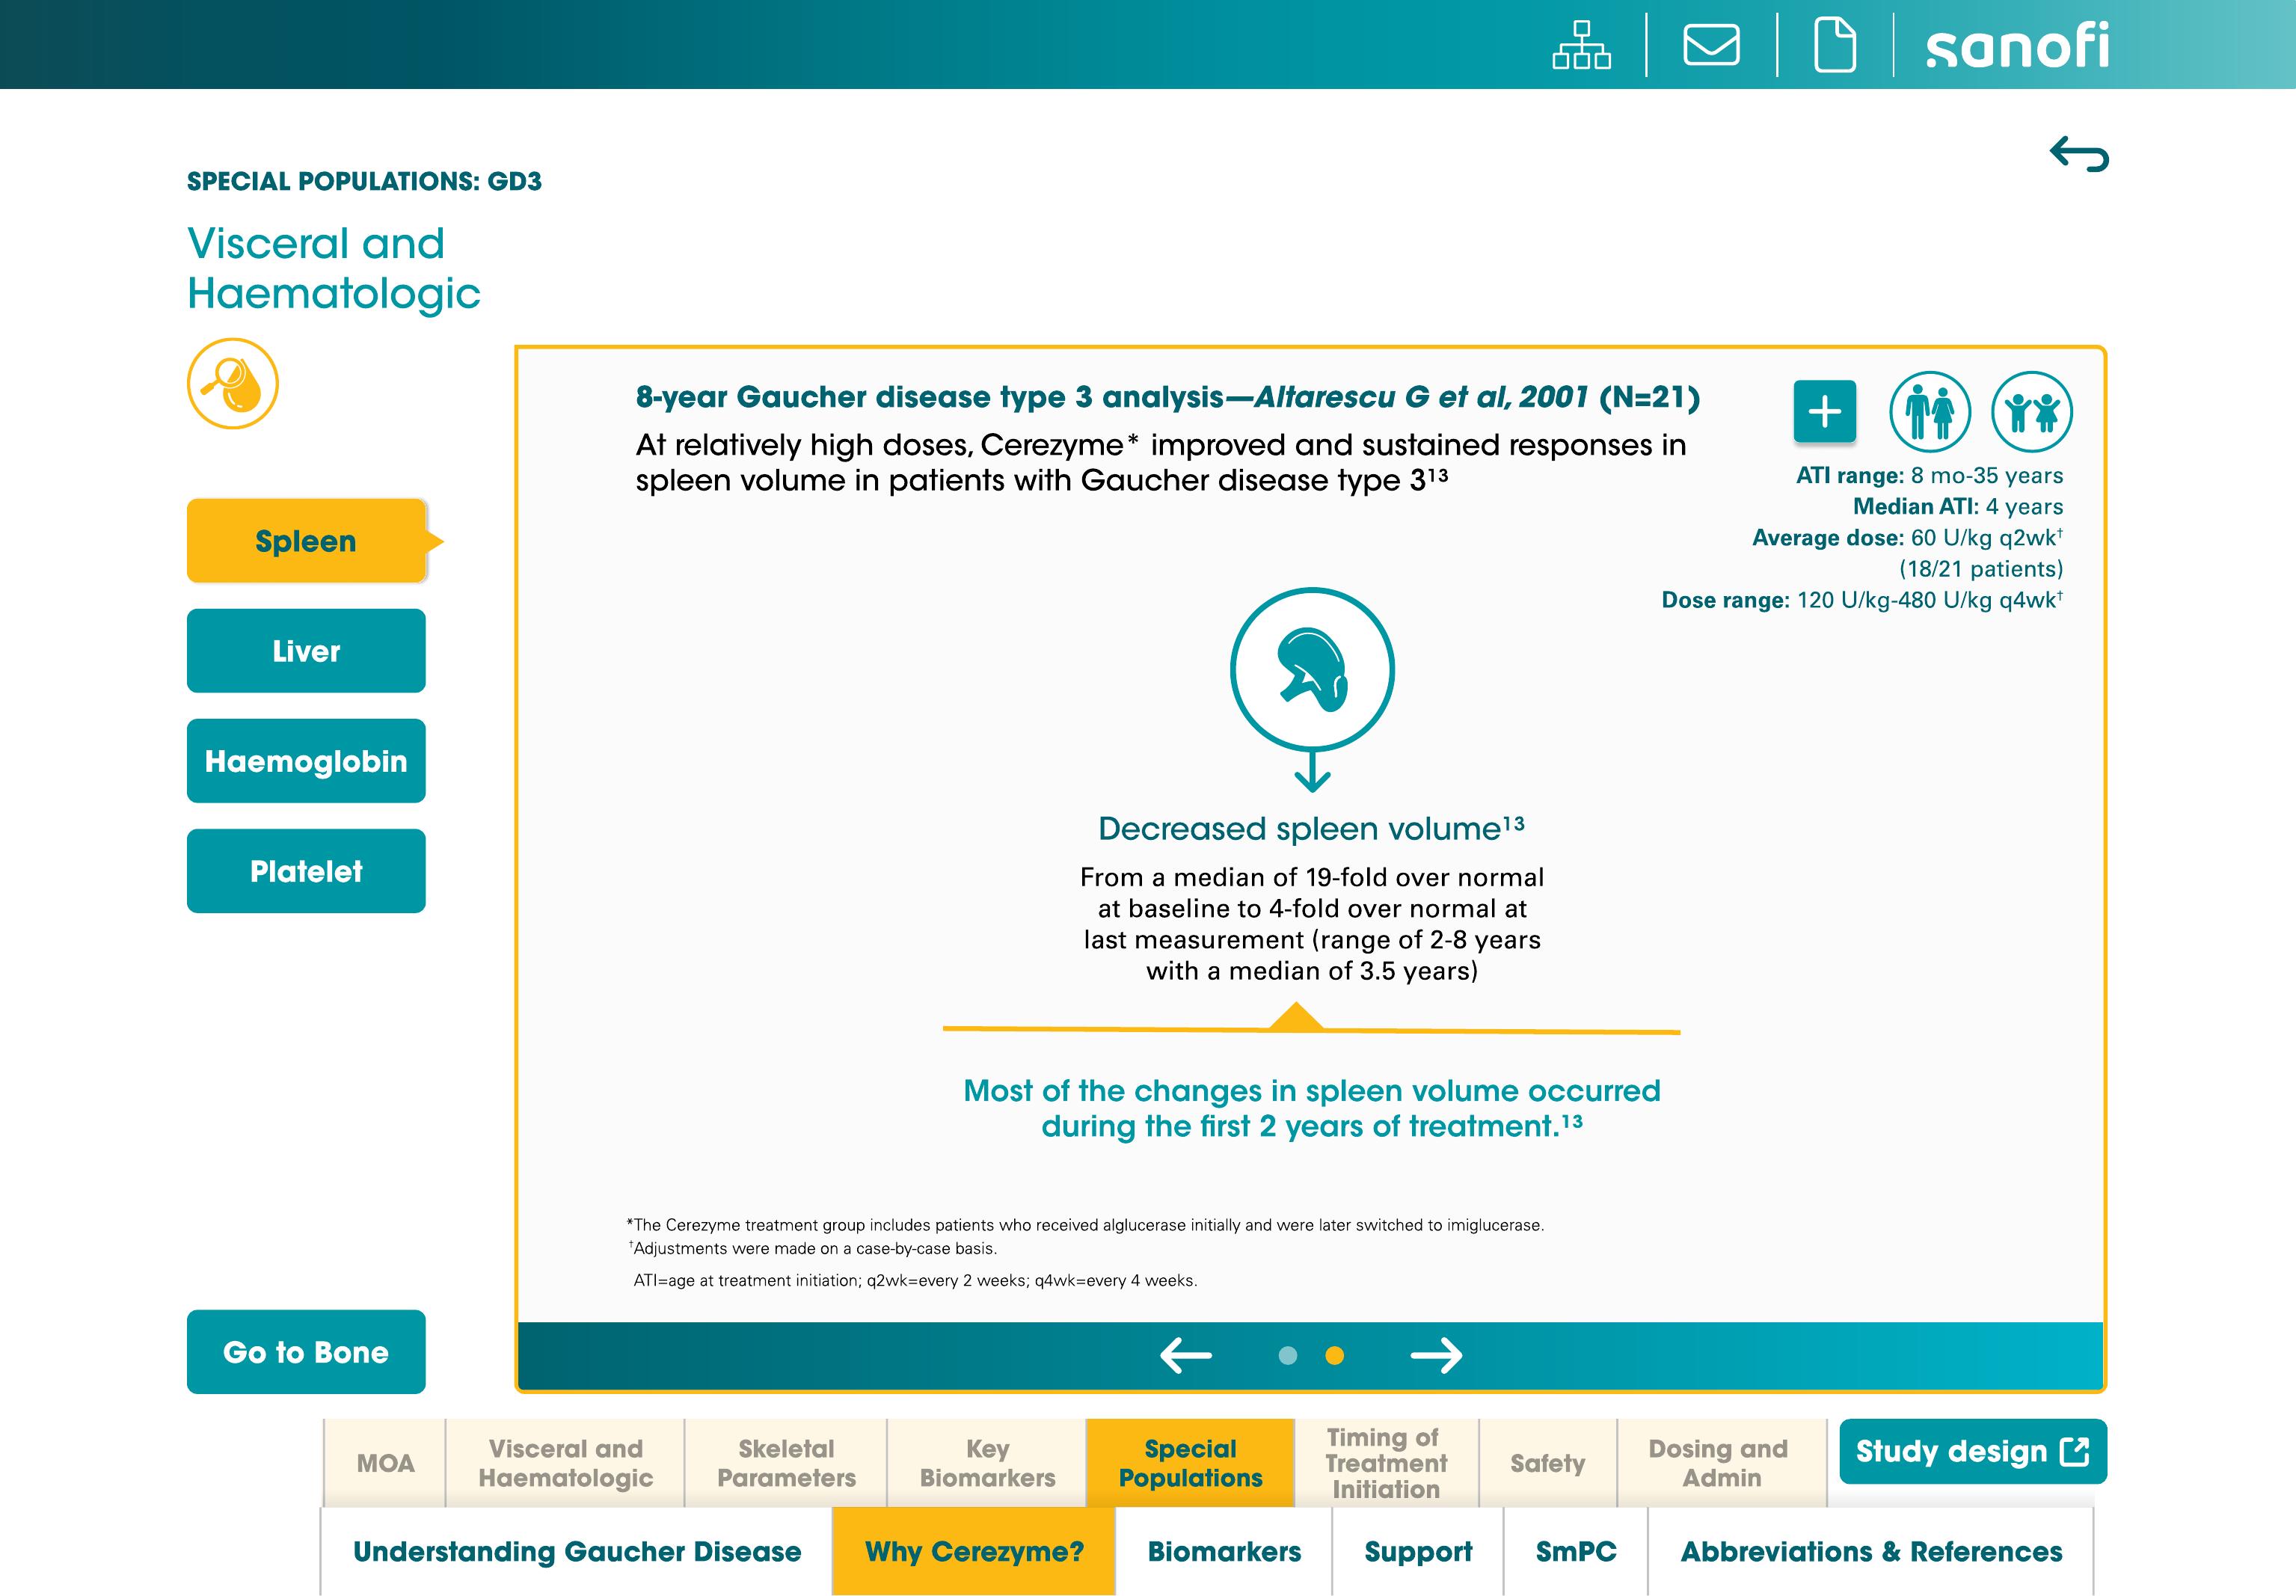
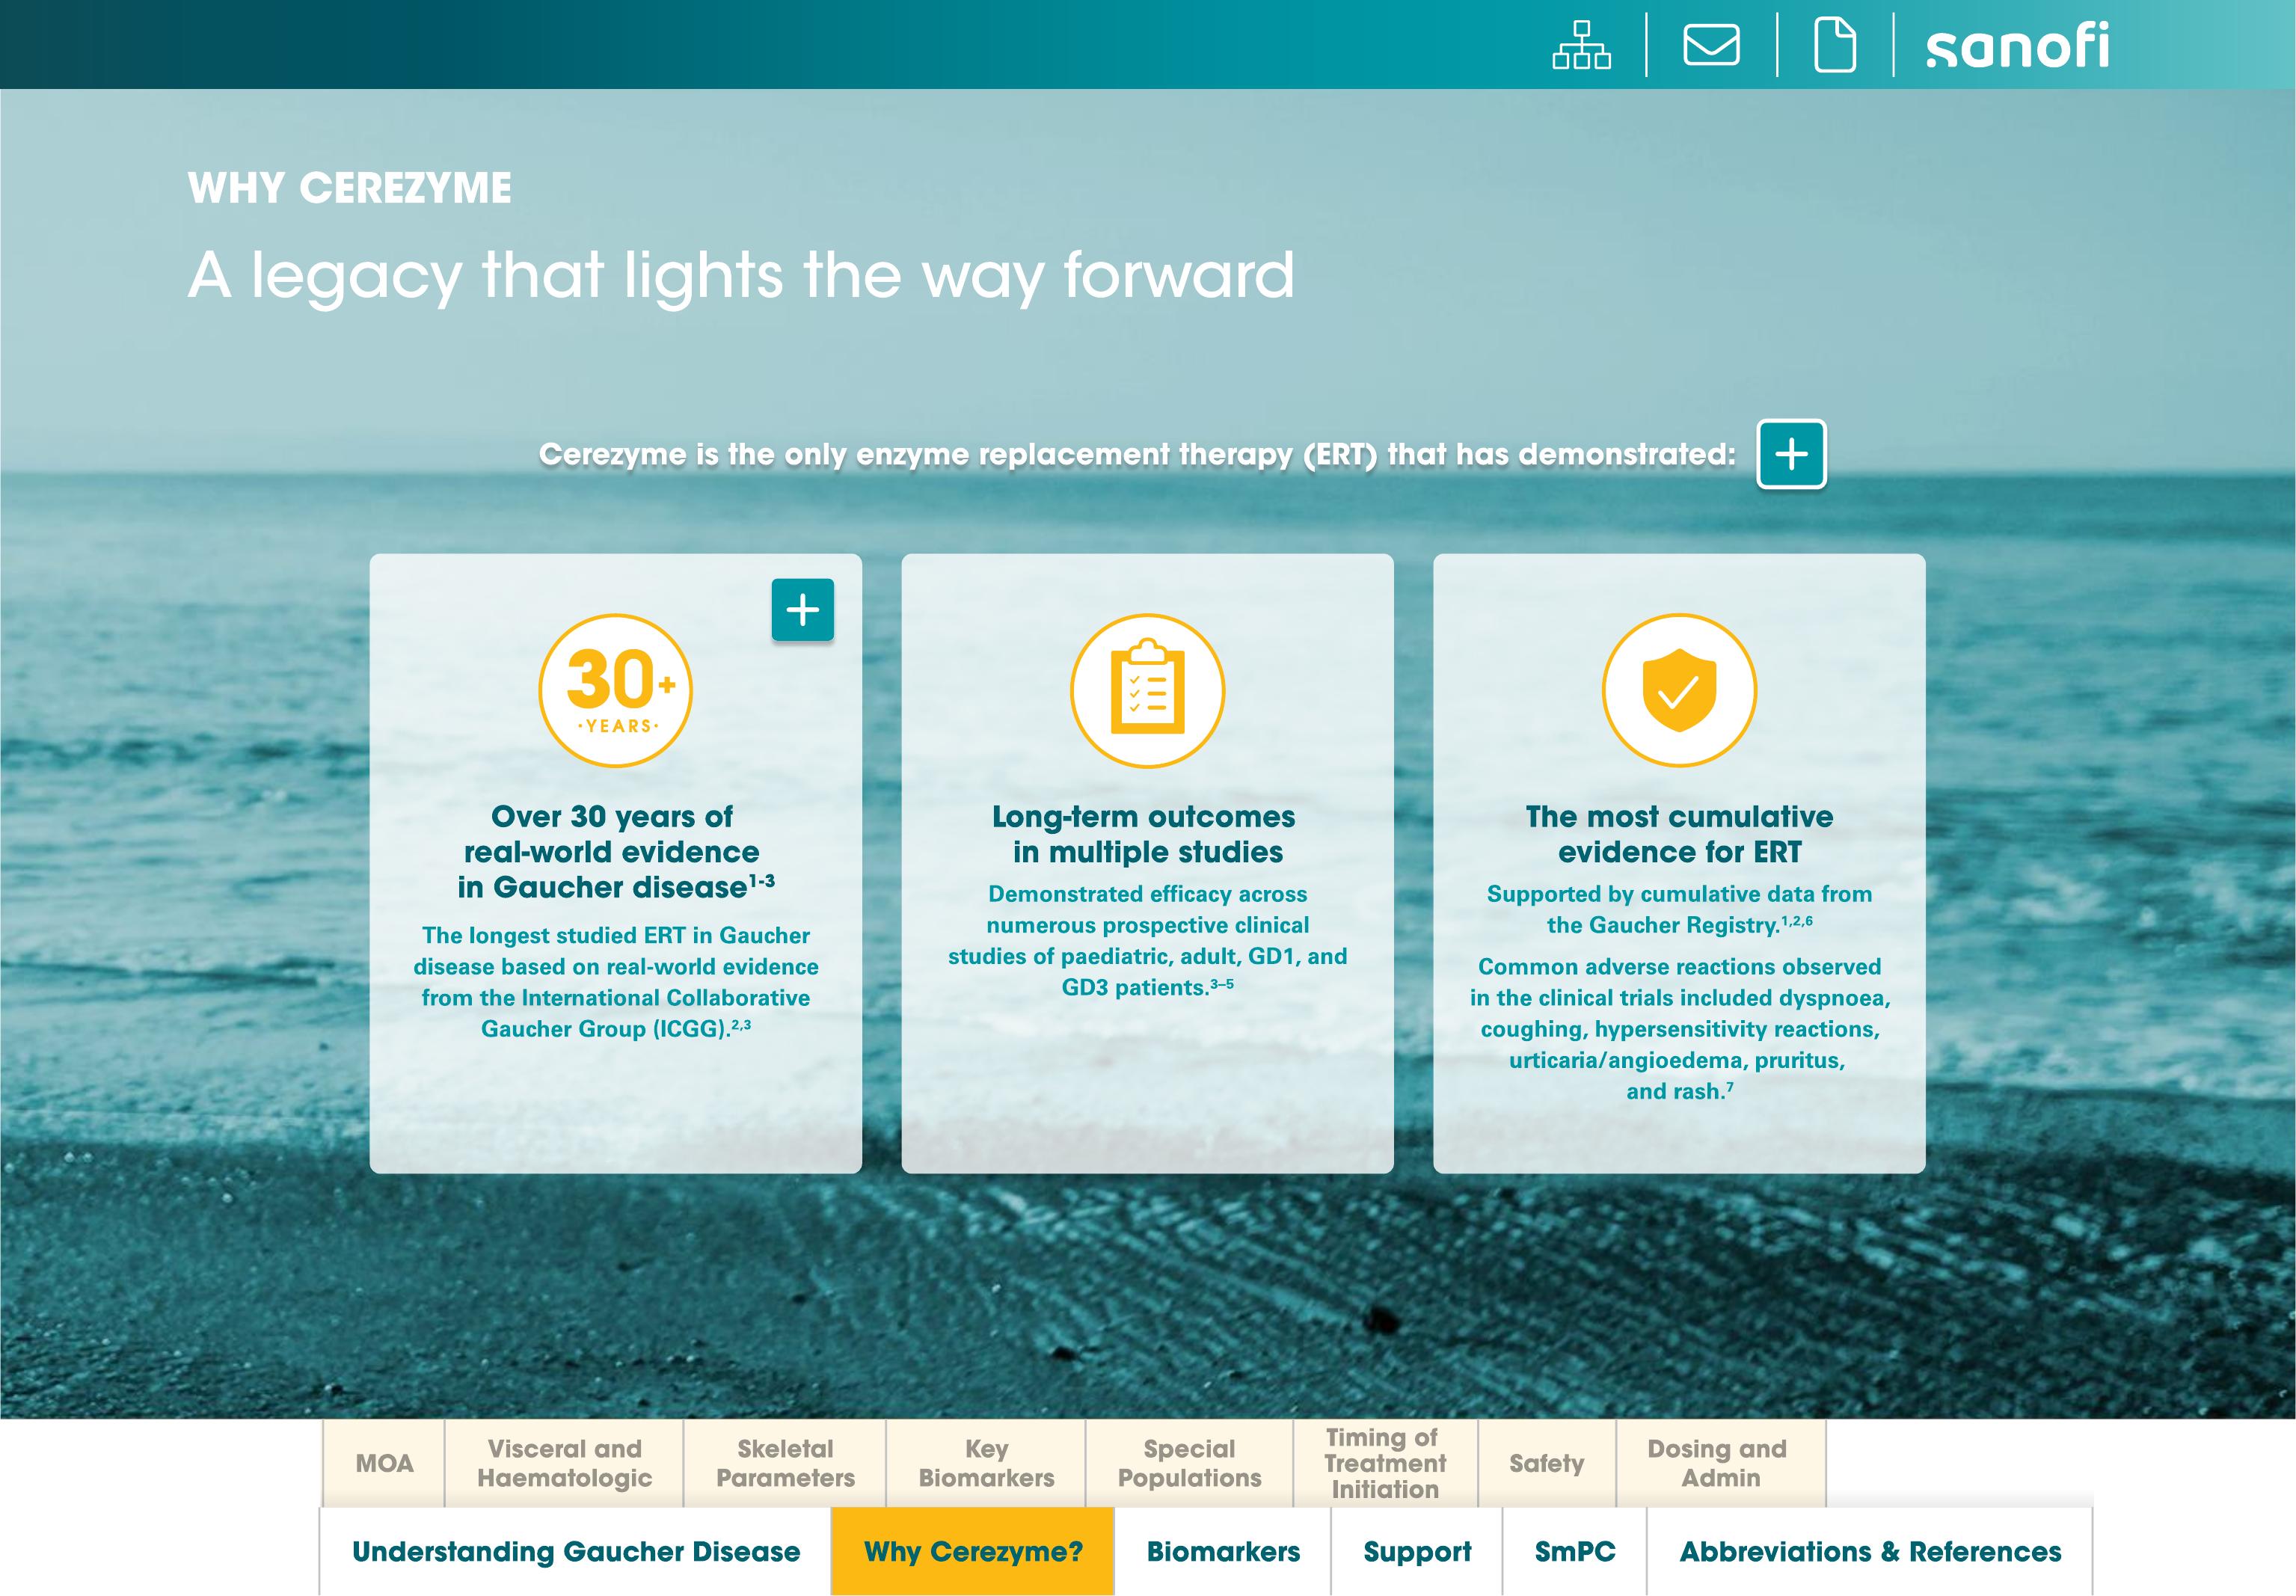
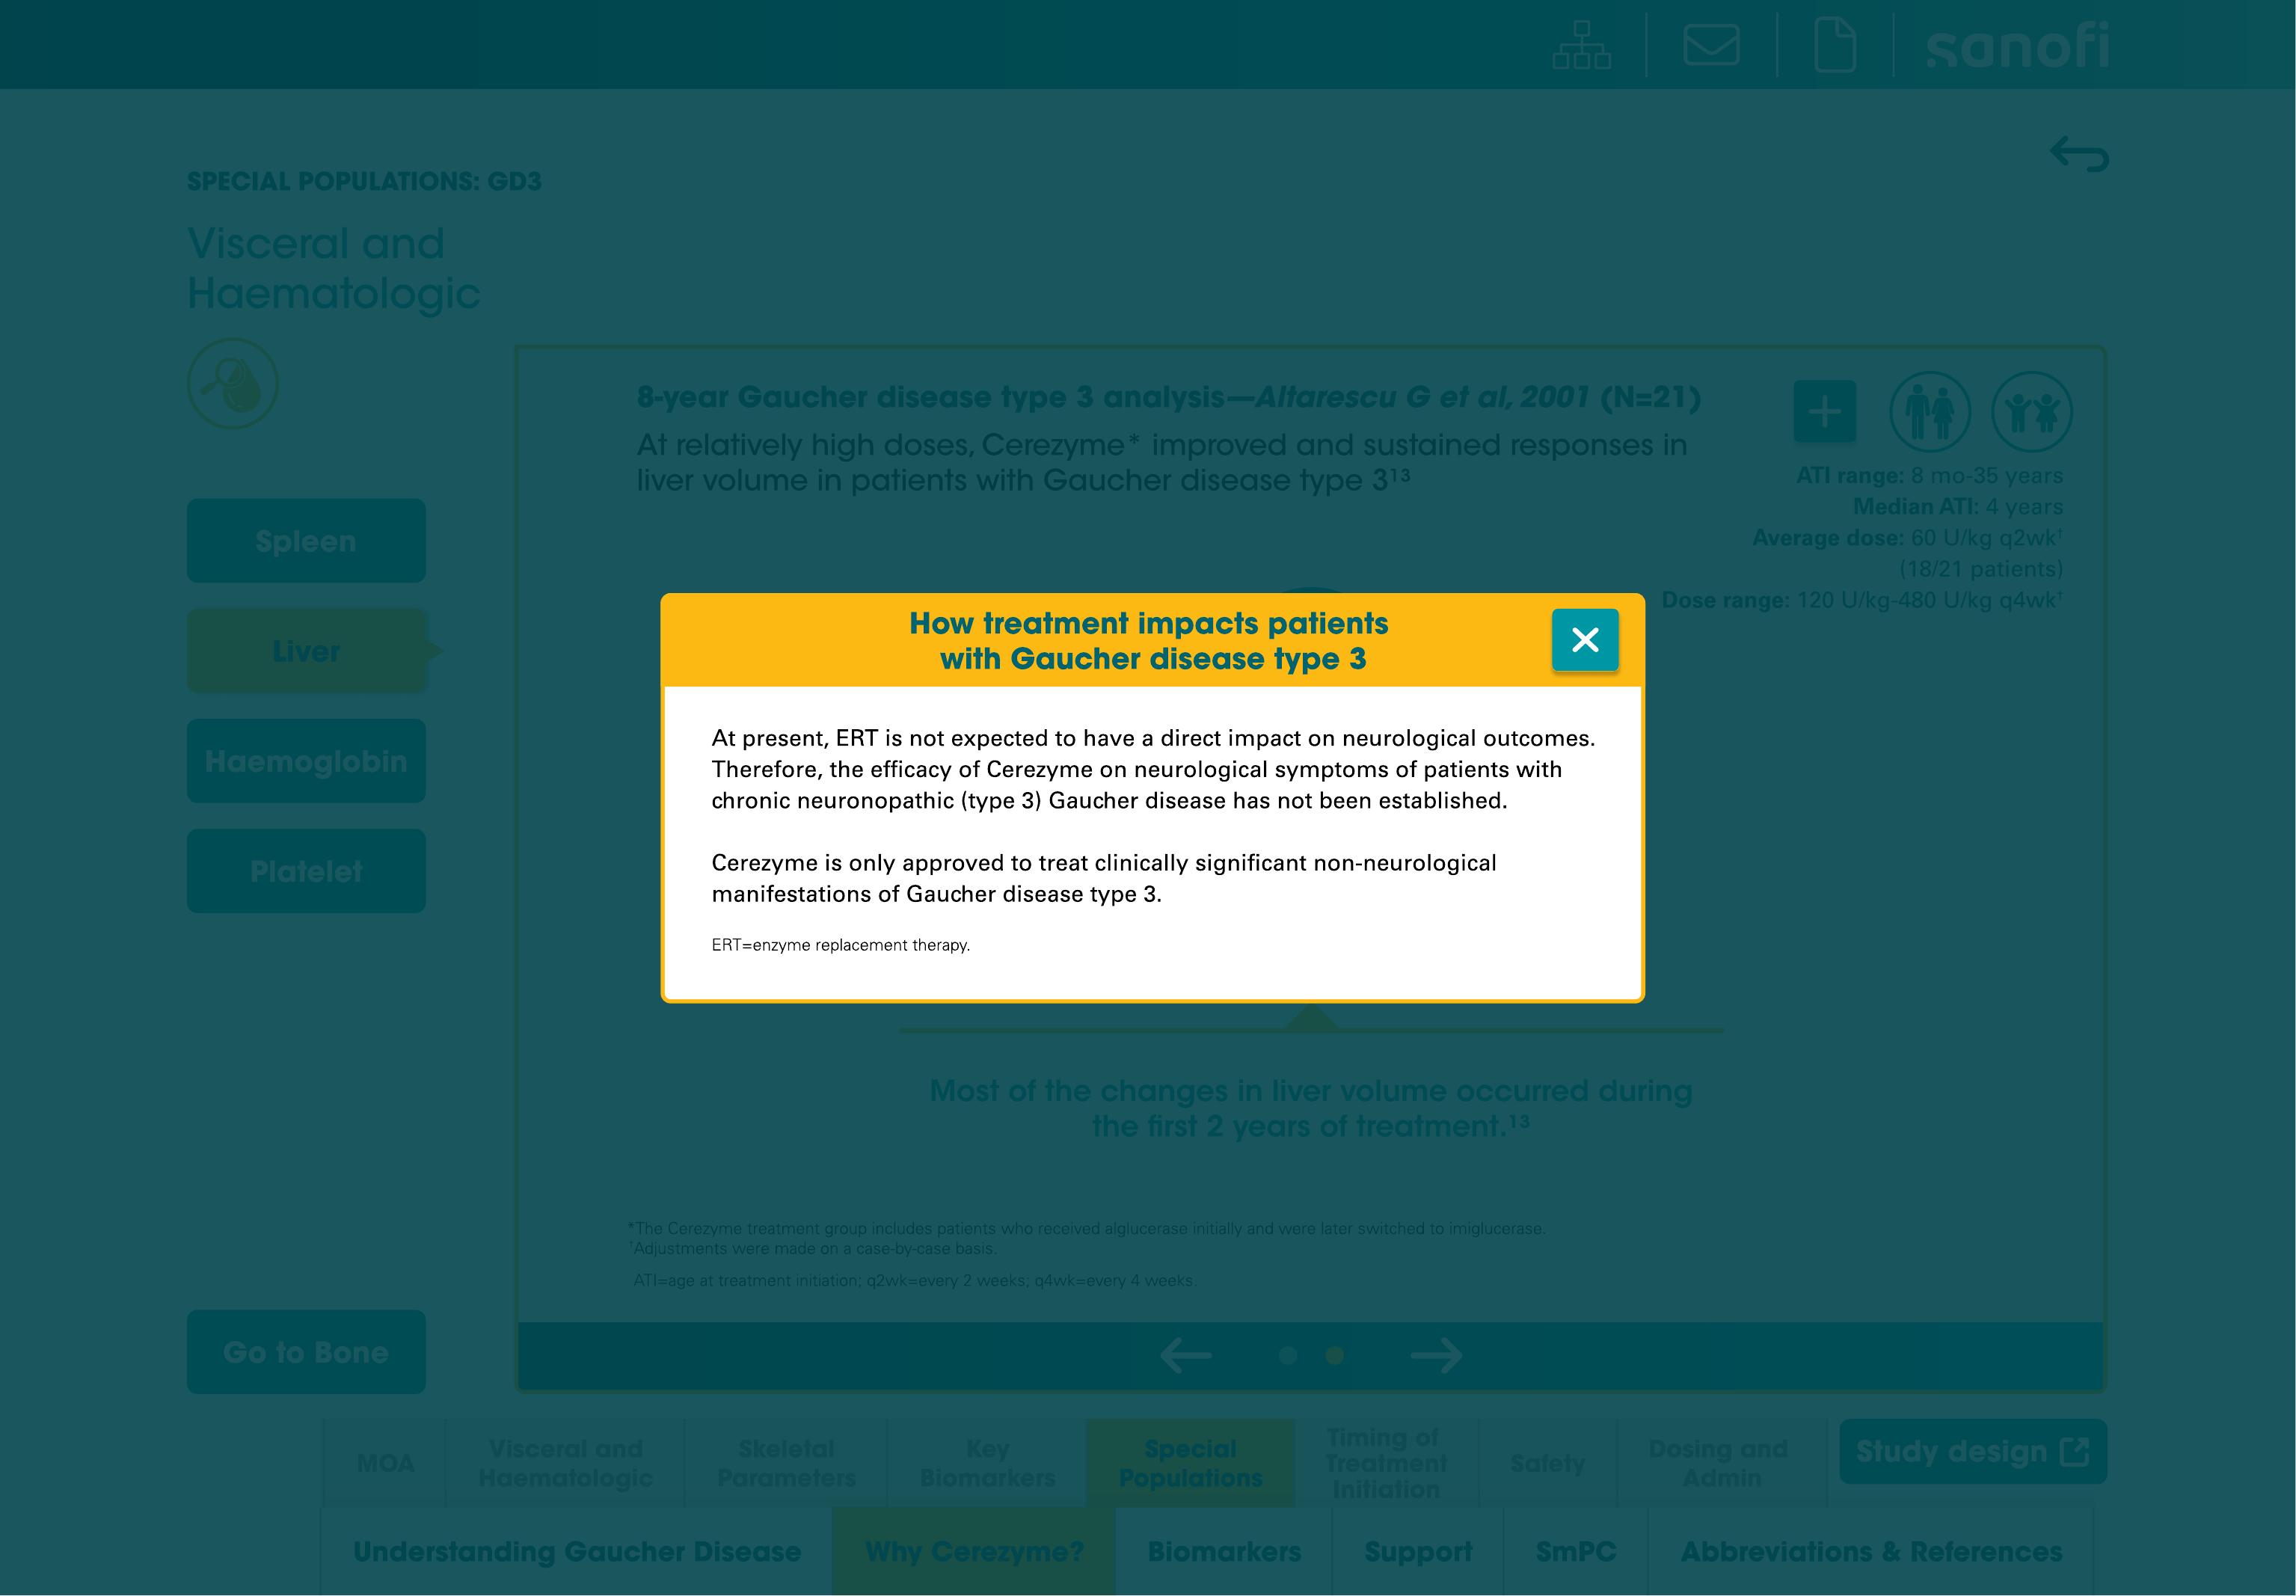
We rebuilt it as a non-linear tool. A clickable site map replaced the text table of contents. Navigation was rebuilt so a rep can get from any screen to any endpoint in a couple of taps instead of scrolling through sections that do not apply. Flip cards, tabs, and pop-ups replaced static pages, so the same screen can hold a headline stat and the full data behind it without crowding either.
The update also folded in two years of newer Gaucher campaigns: the bone symptom and skeletal data from Bone Health Matters, the realigned GD3 narrative from Gaucher Disease Type 3 Unfolds, a new biomarker story around GL-1 and lyso-GL-1, and the latest data on early treatment timing.
The full build runs to nearly 150 screens. It was designed in Figma, built out as a working prototype, then handed to development for the final iPad build. It also had to work as a global piece, not just a US one, so every layout carried extra space in its guidelines from the start to hold text that runs longer once it is translated.
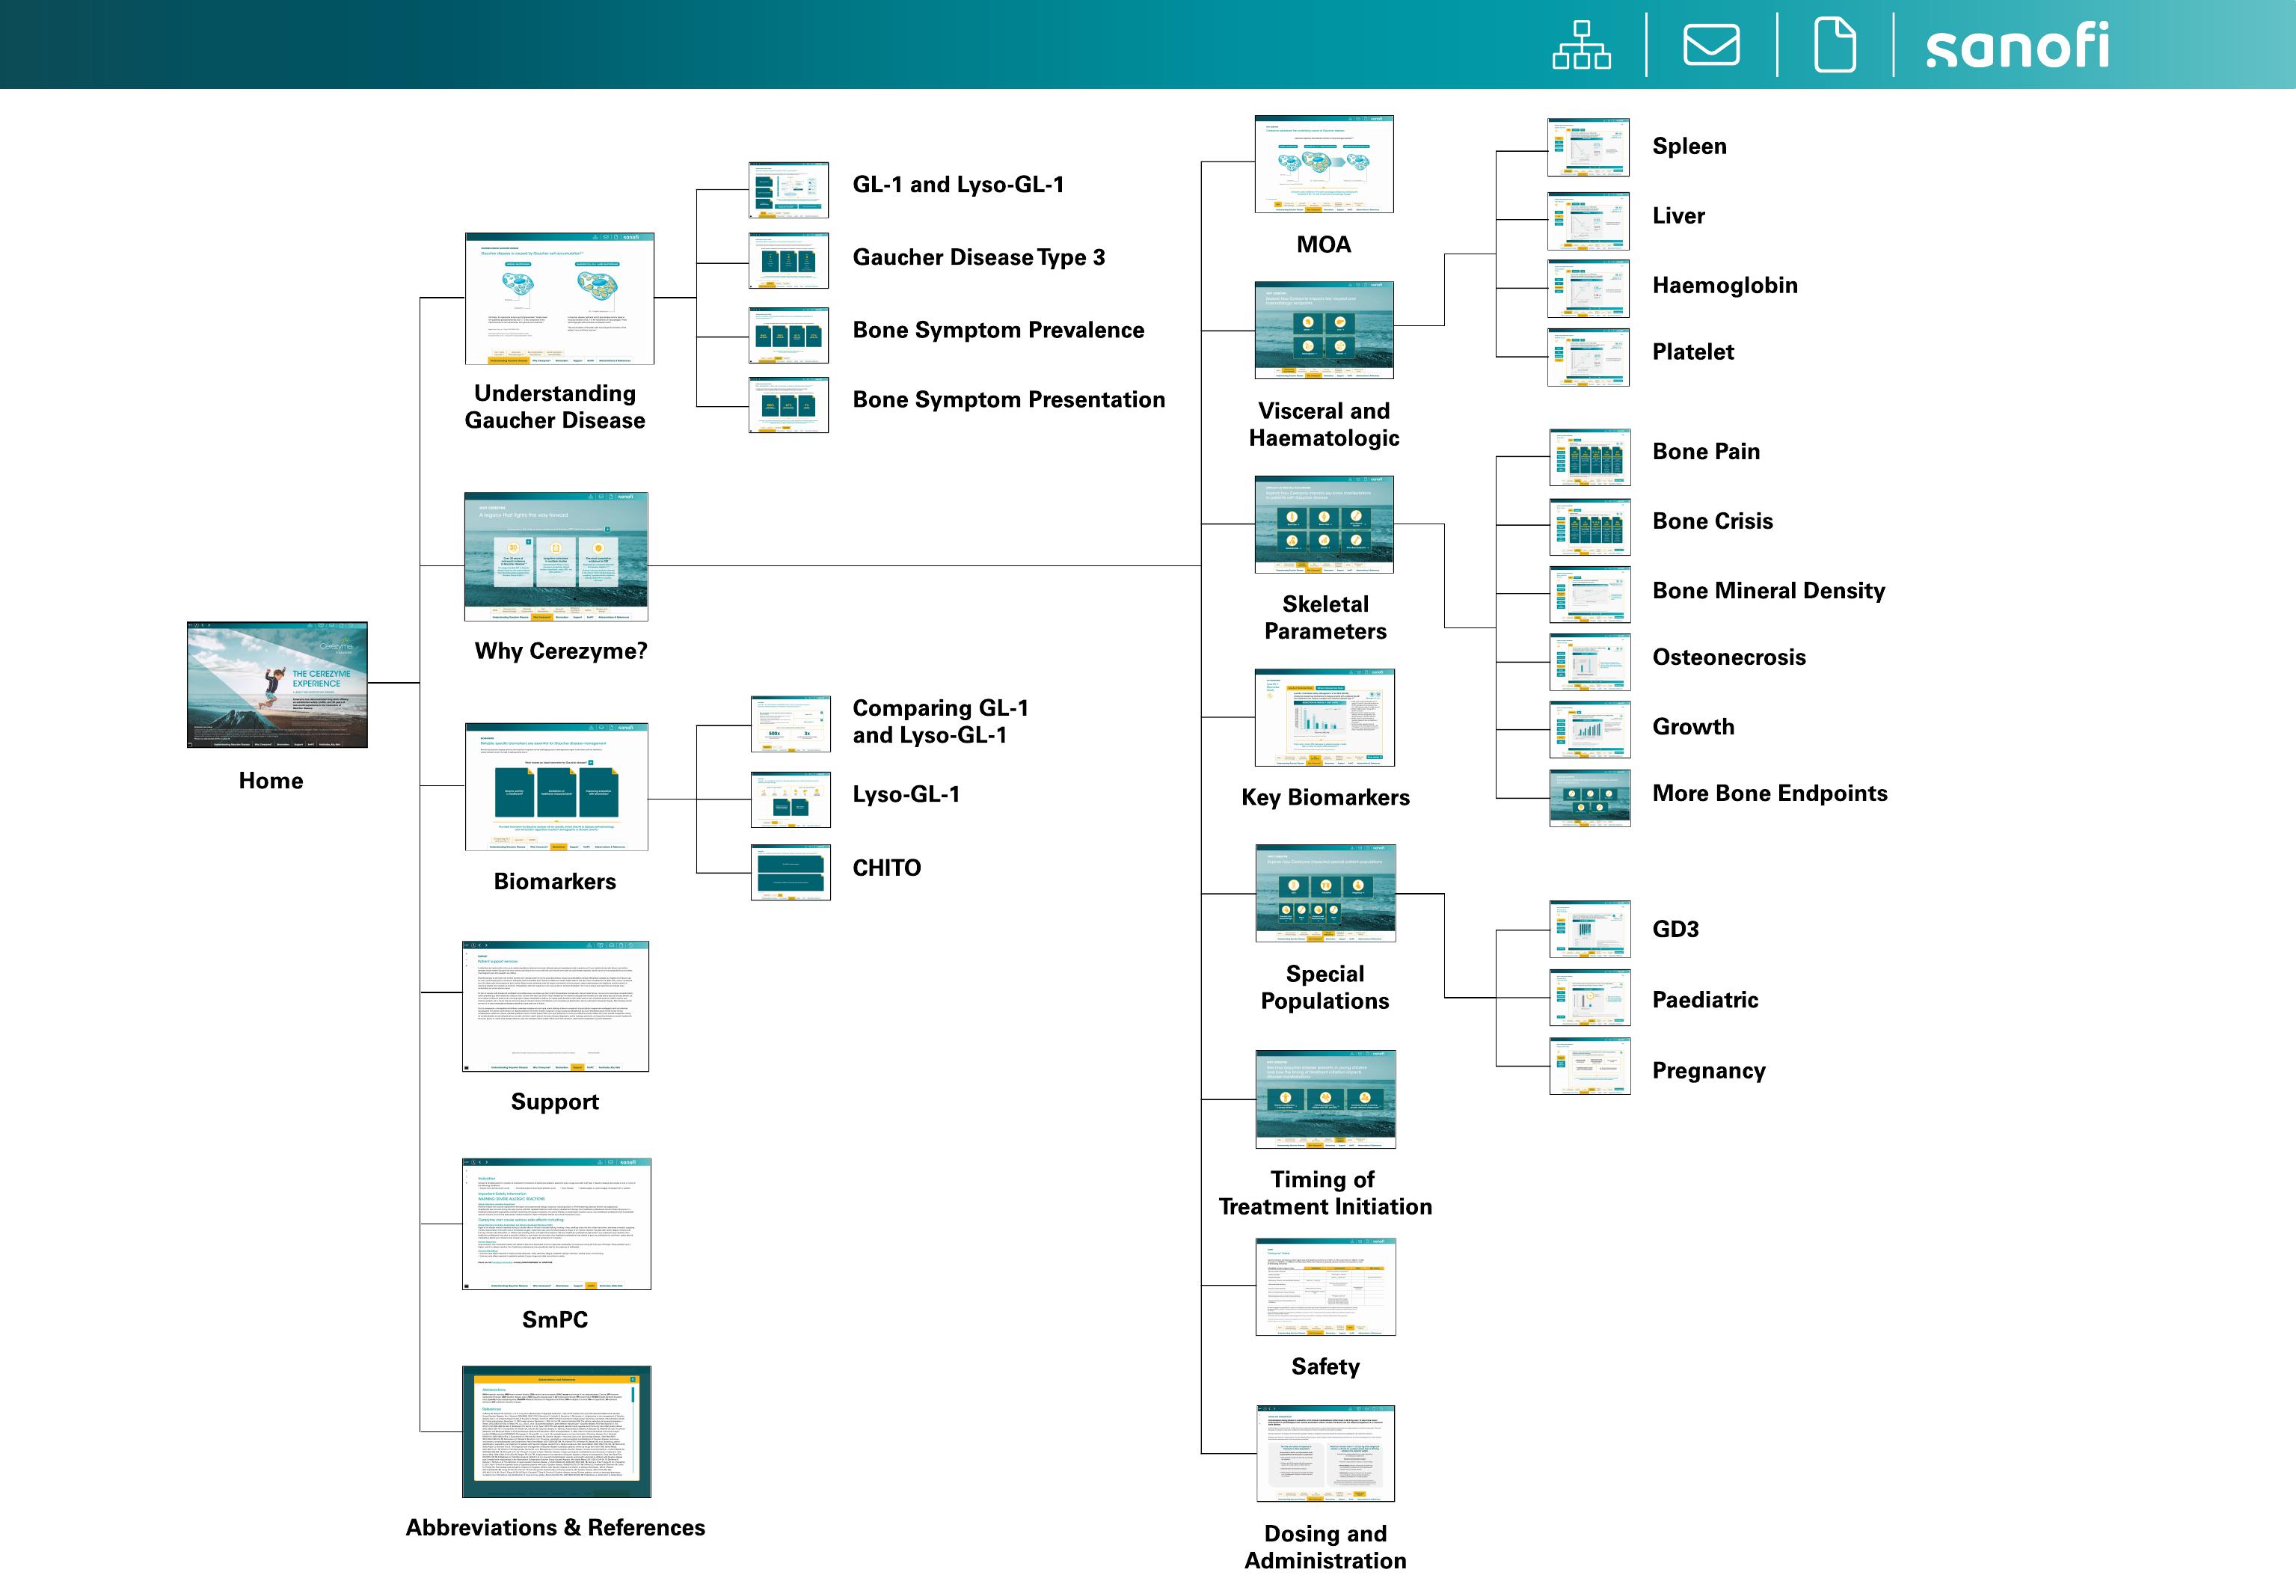
The original tool buried its structure in a text list. The rebuild surfaces the whole tree up front, so a rep can see the full range of the conversation before choosing where to start.
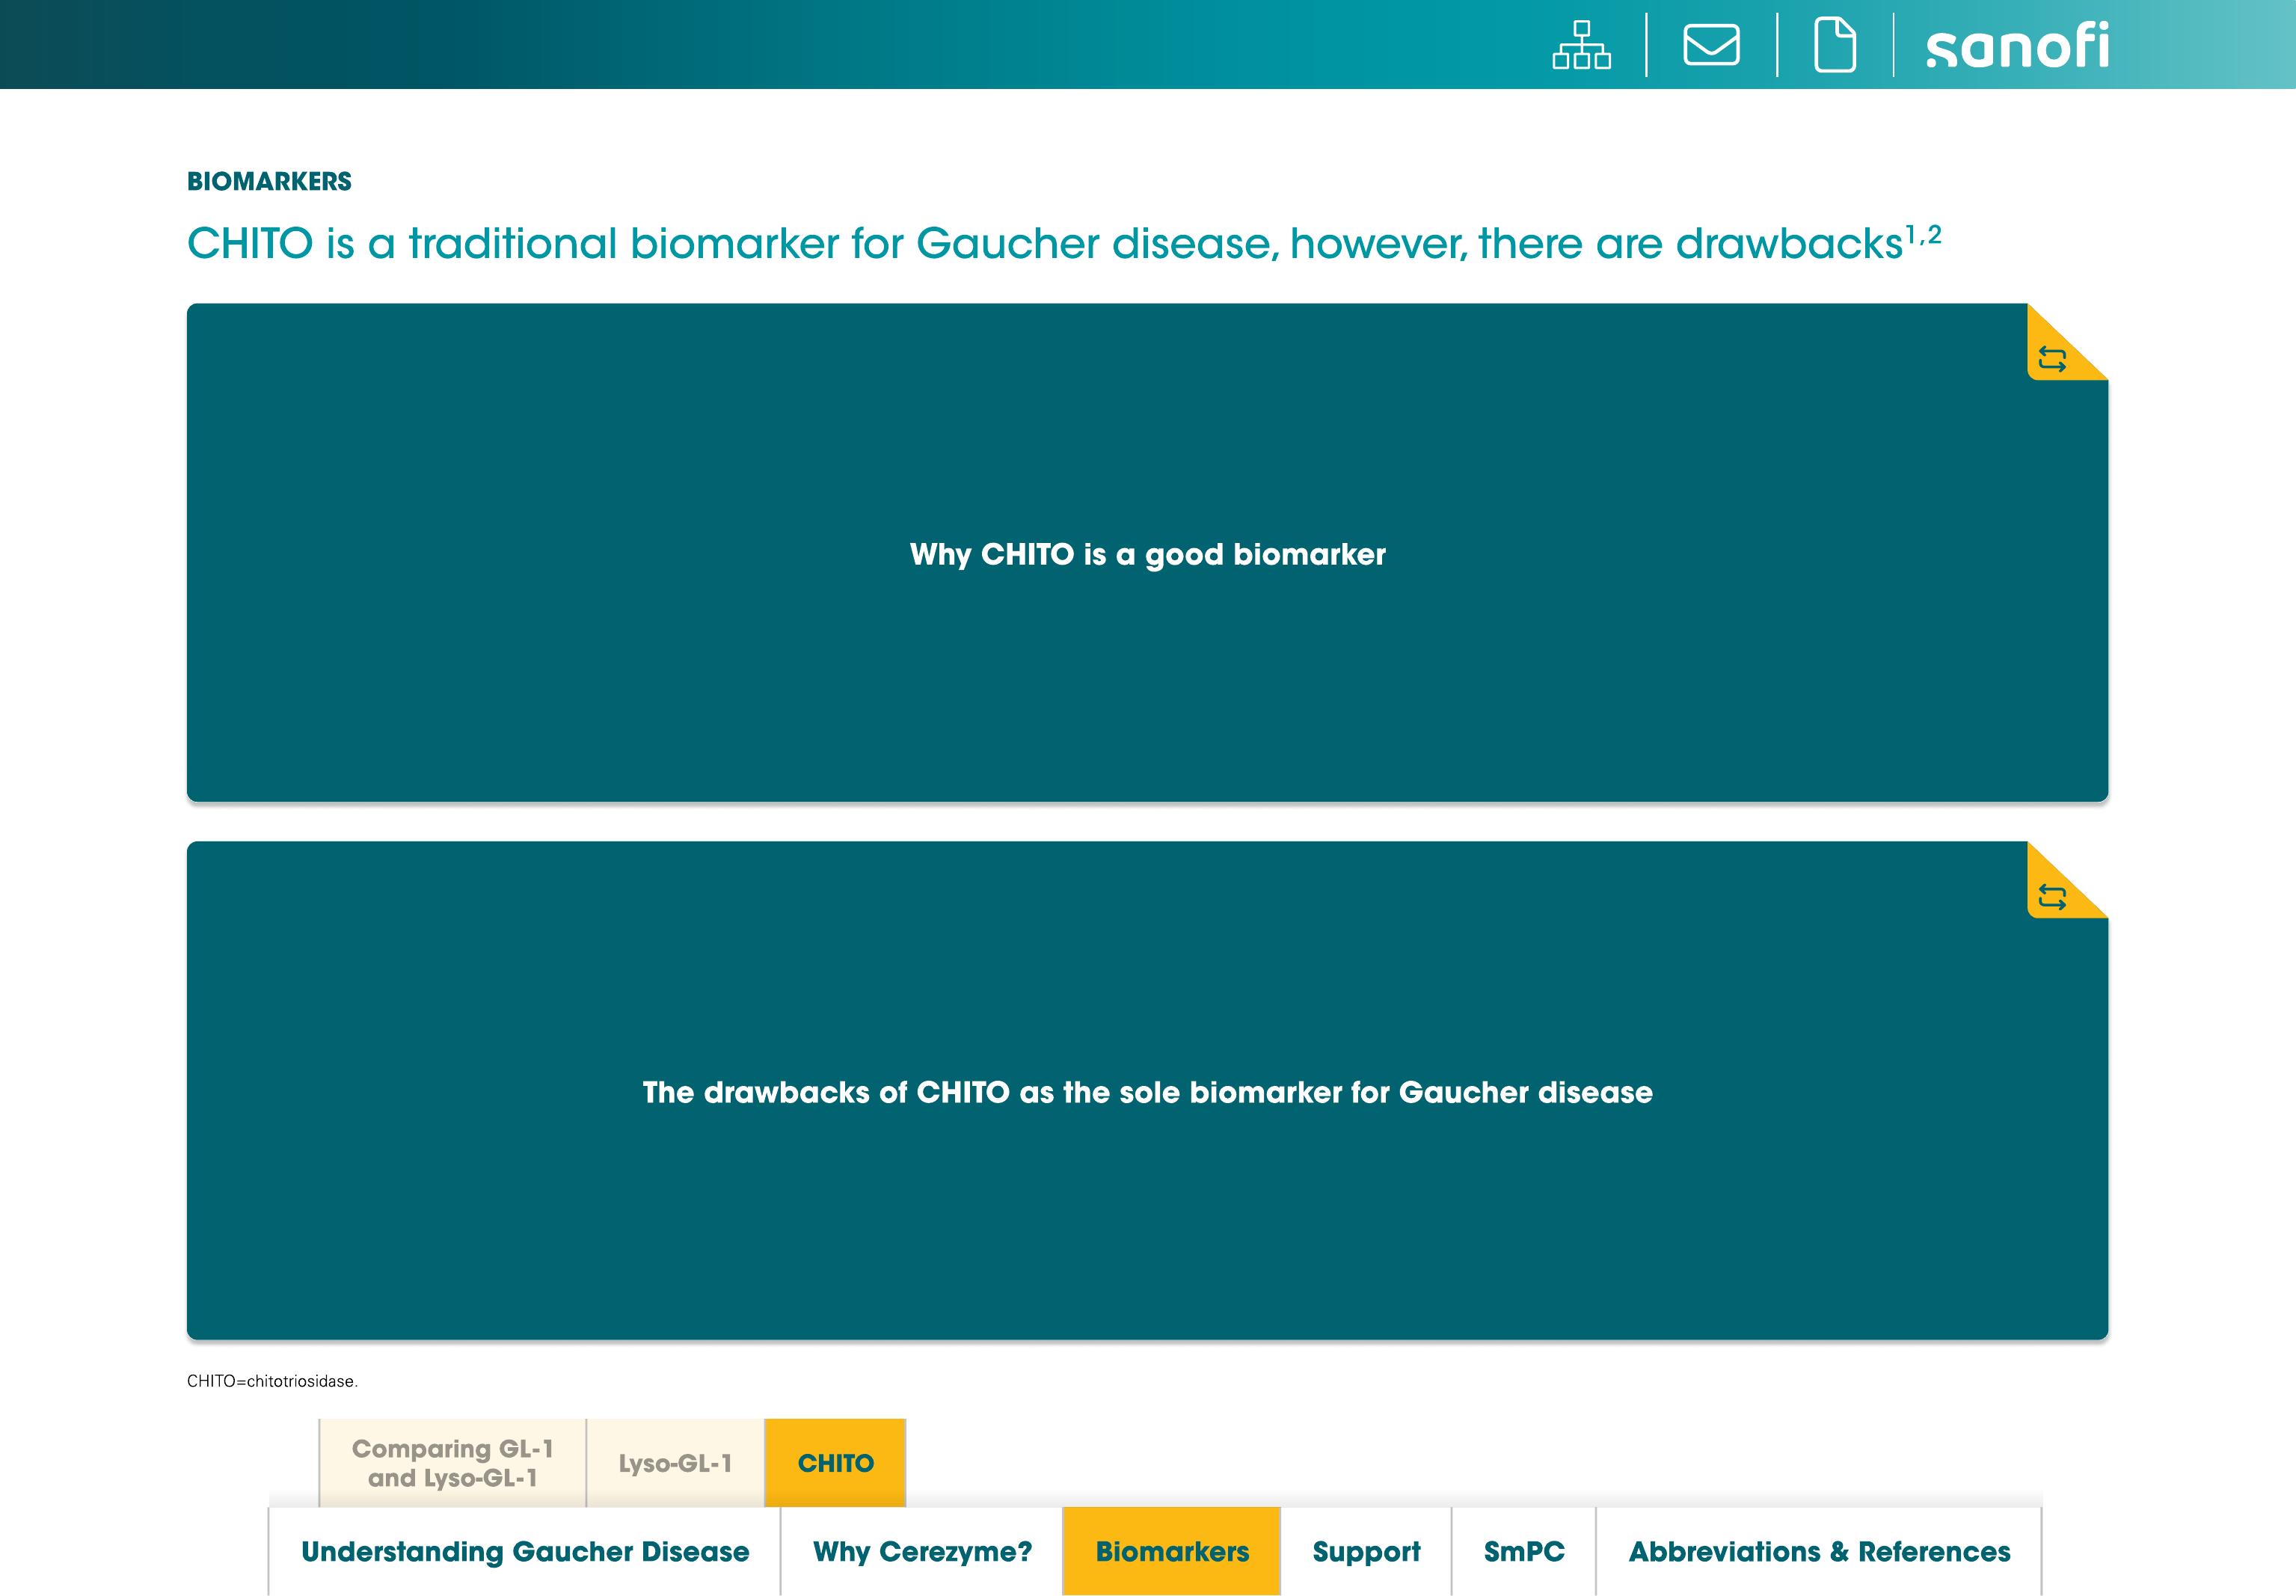
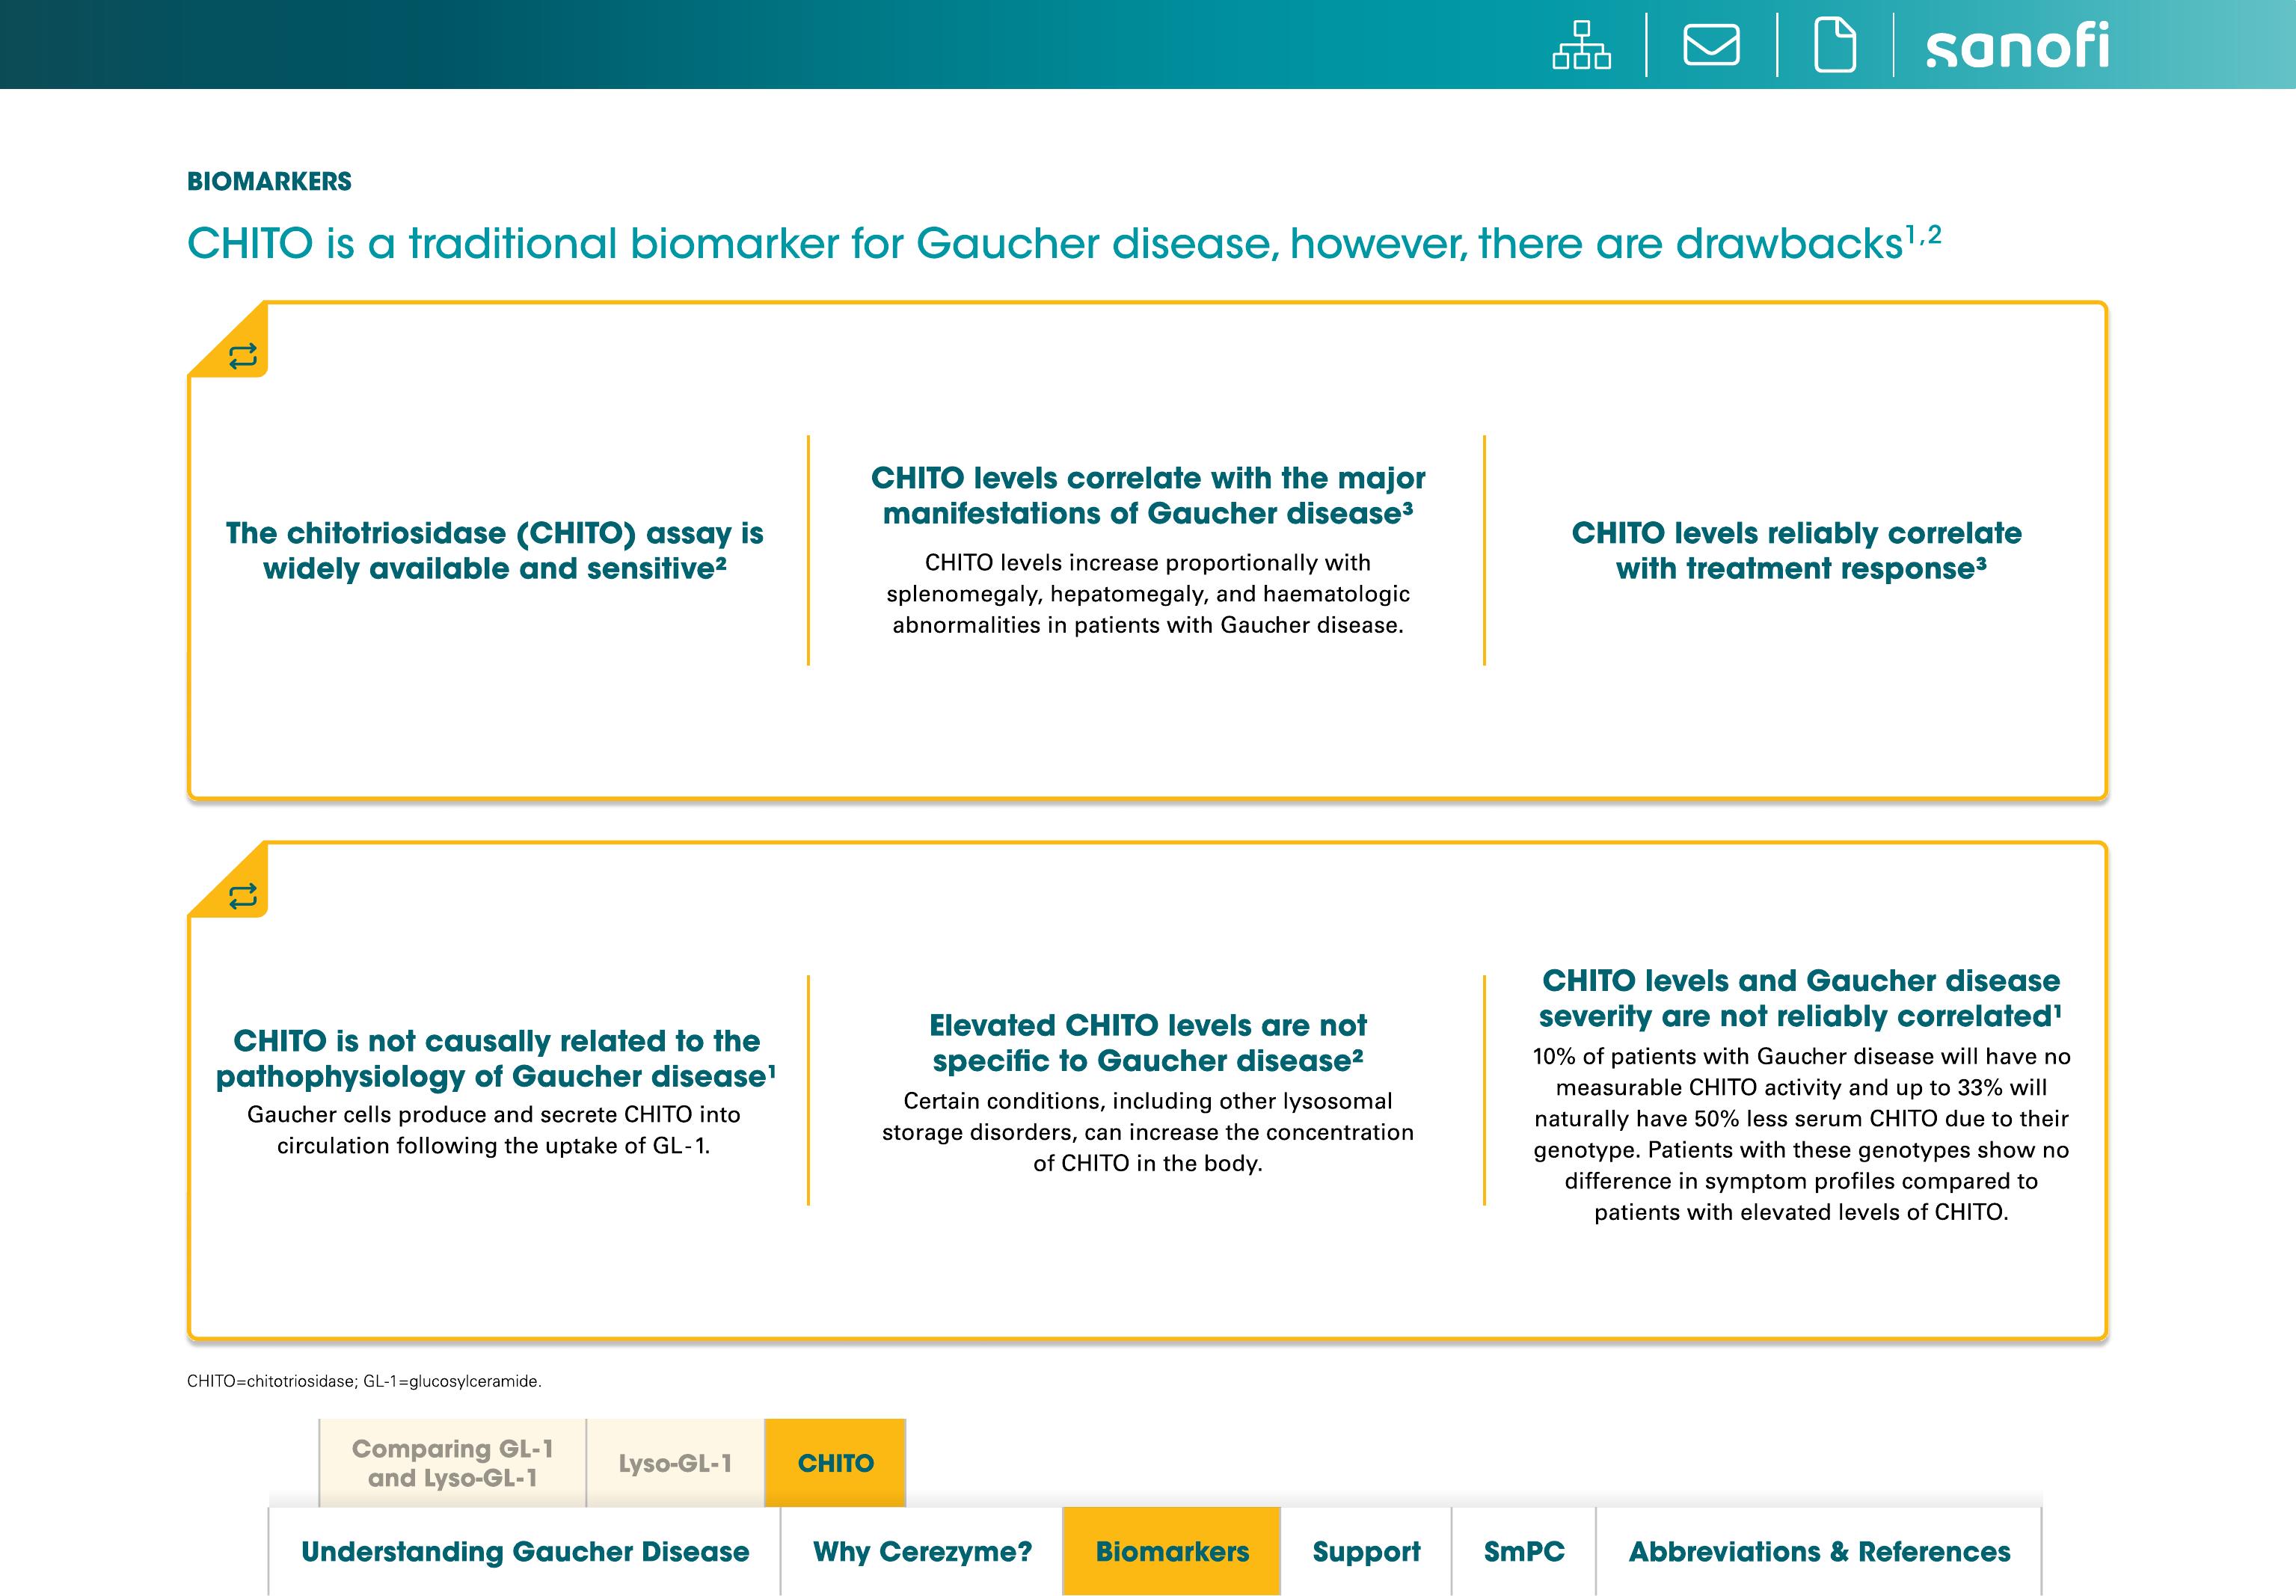
Every headline stat opens into its own explanation with a tap, so a dense screen can lead with a number and still hold the full sentence behind it. The screens below are the real deck. The flip cards underneath are not built to the same design, they are a functional recreation just to show how the interaction works.
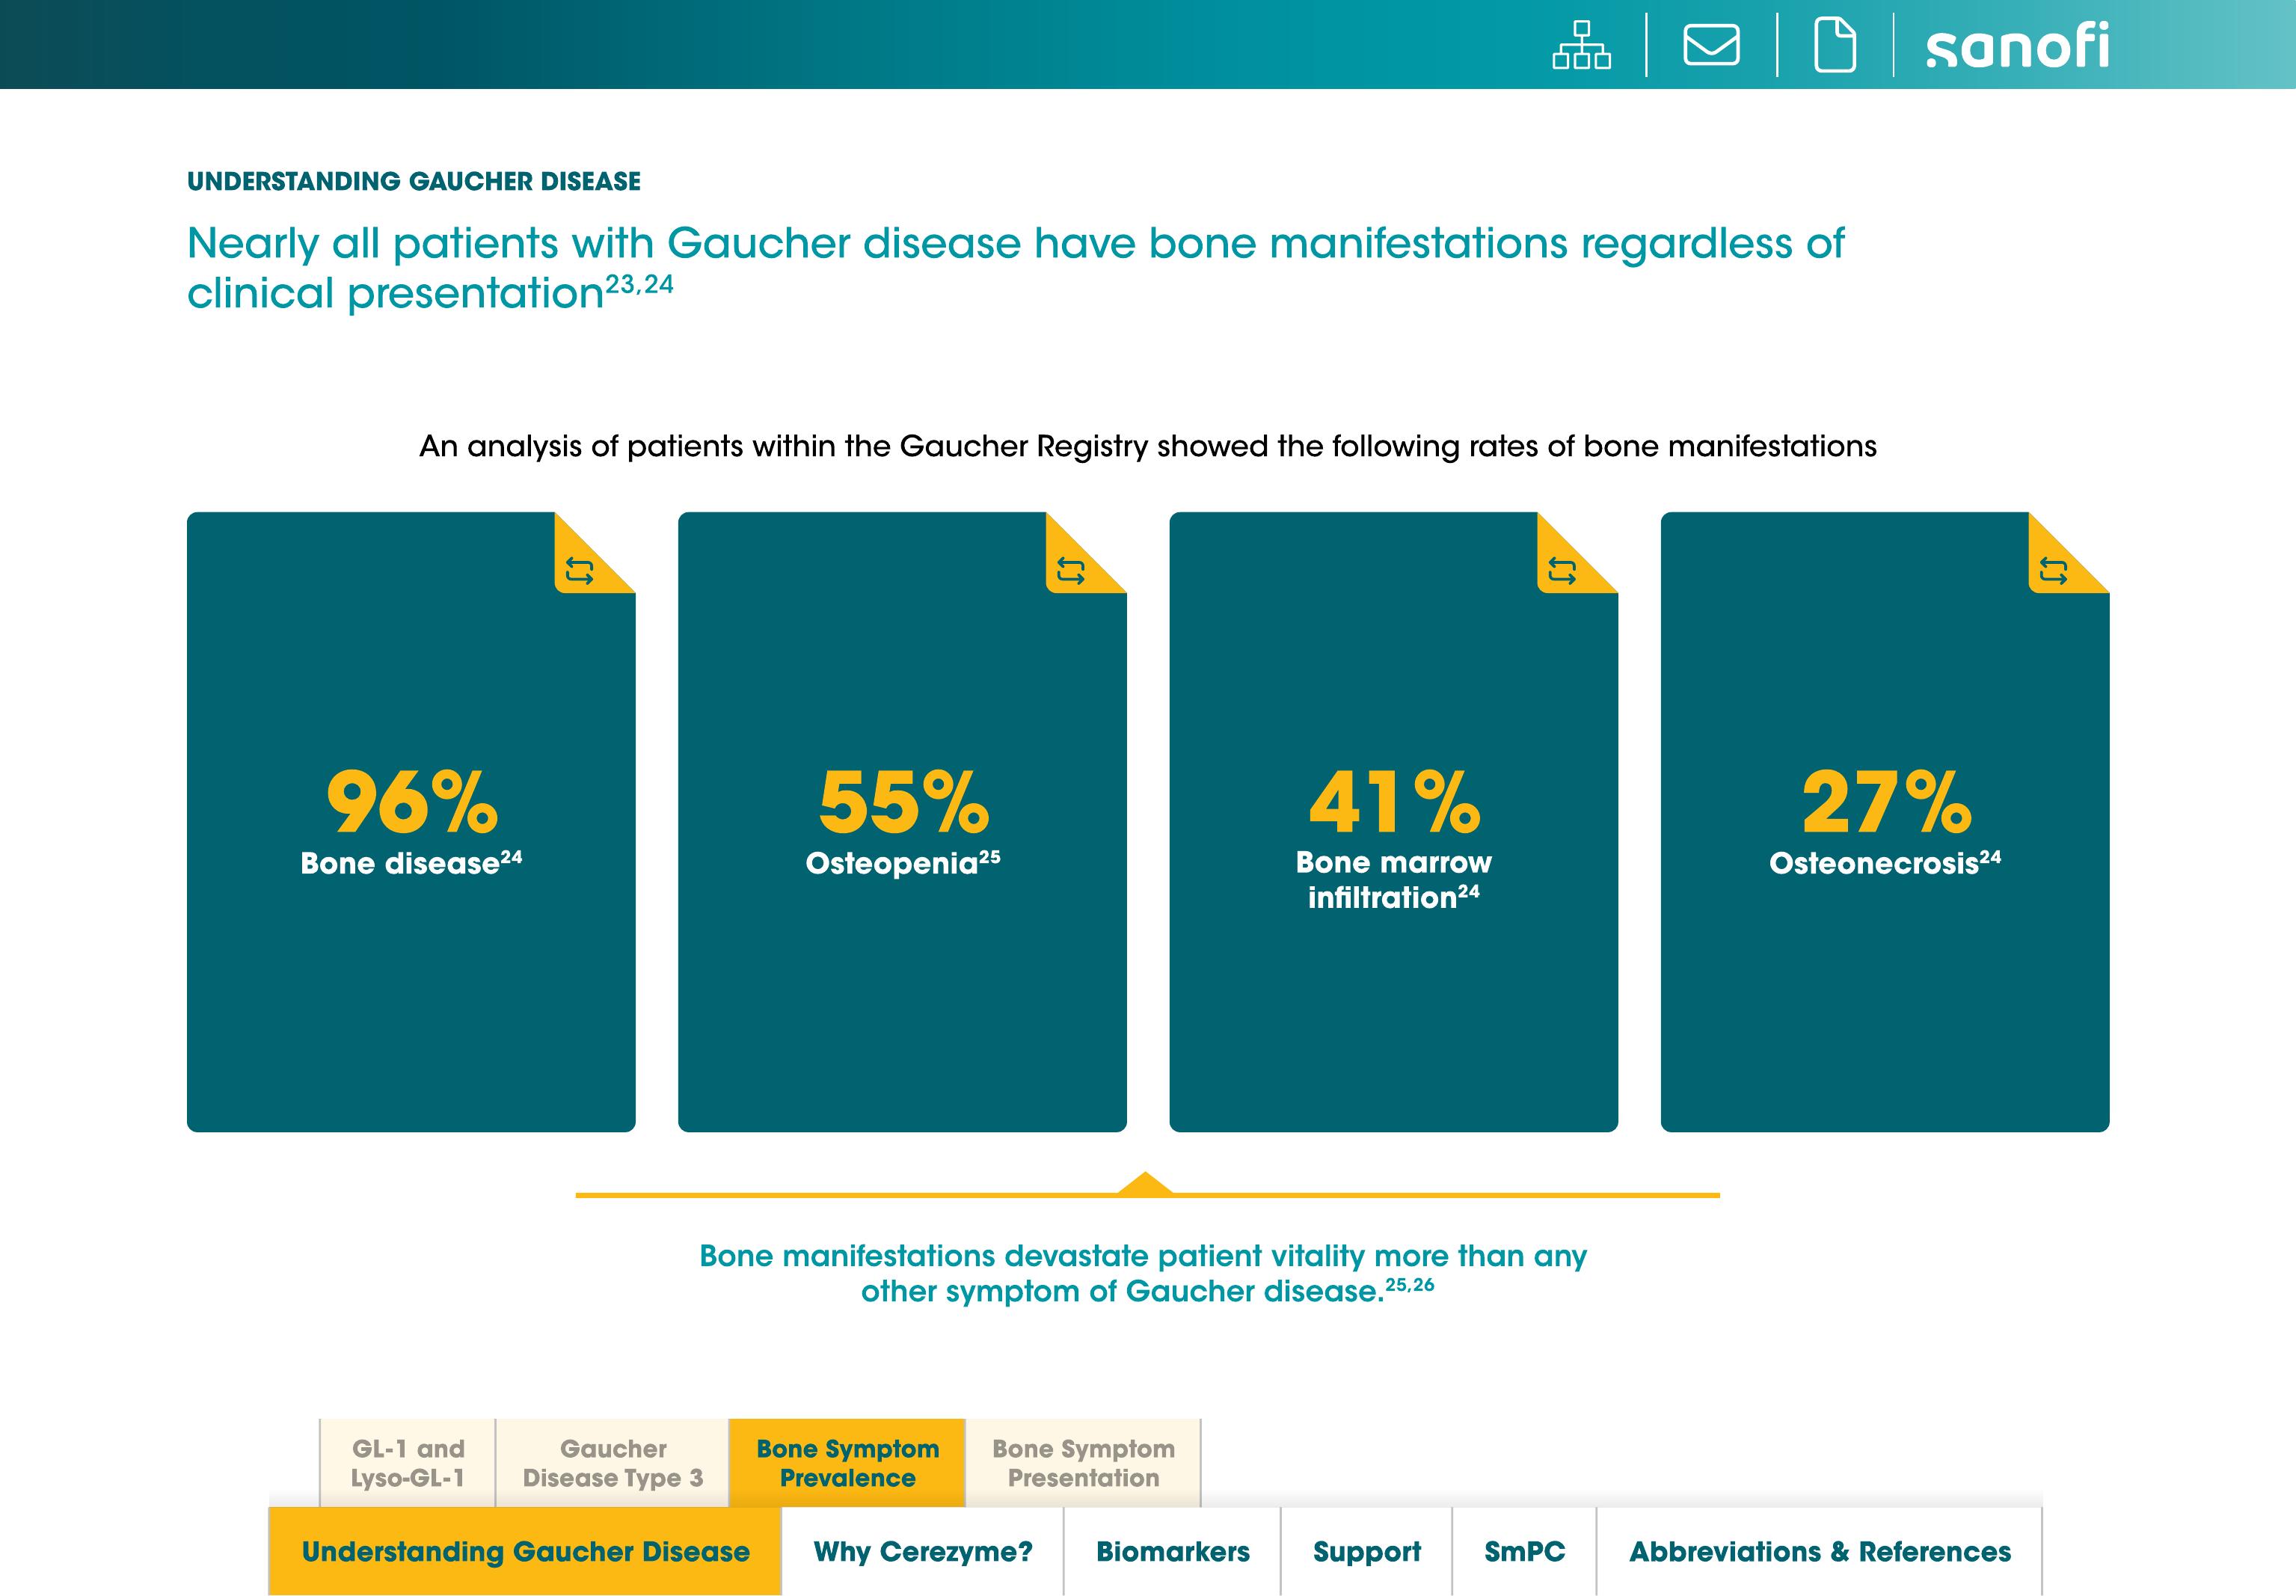
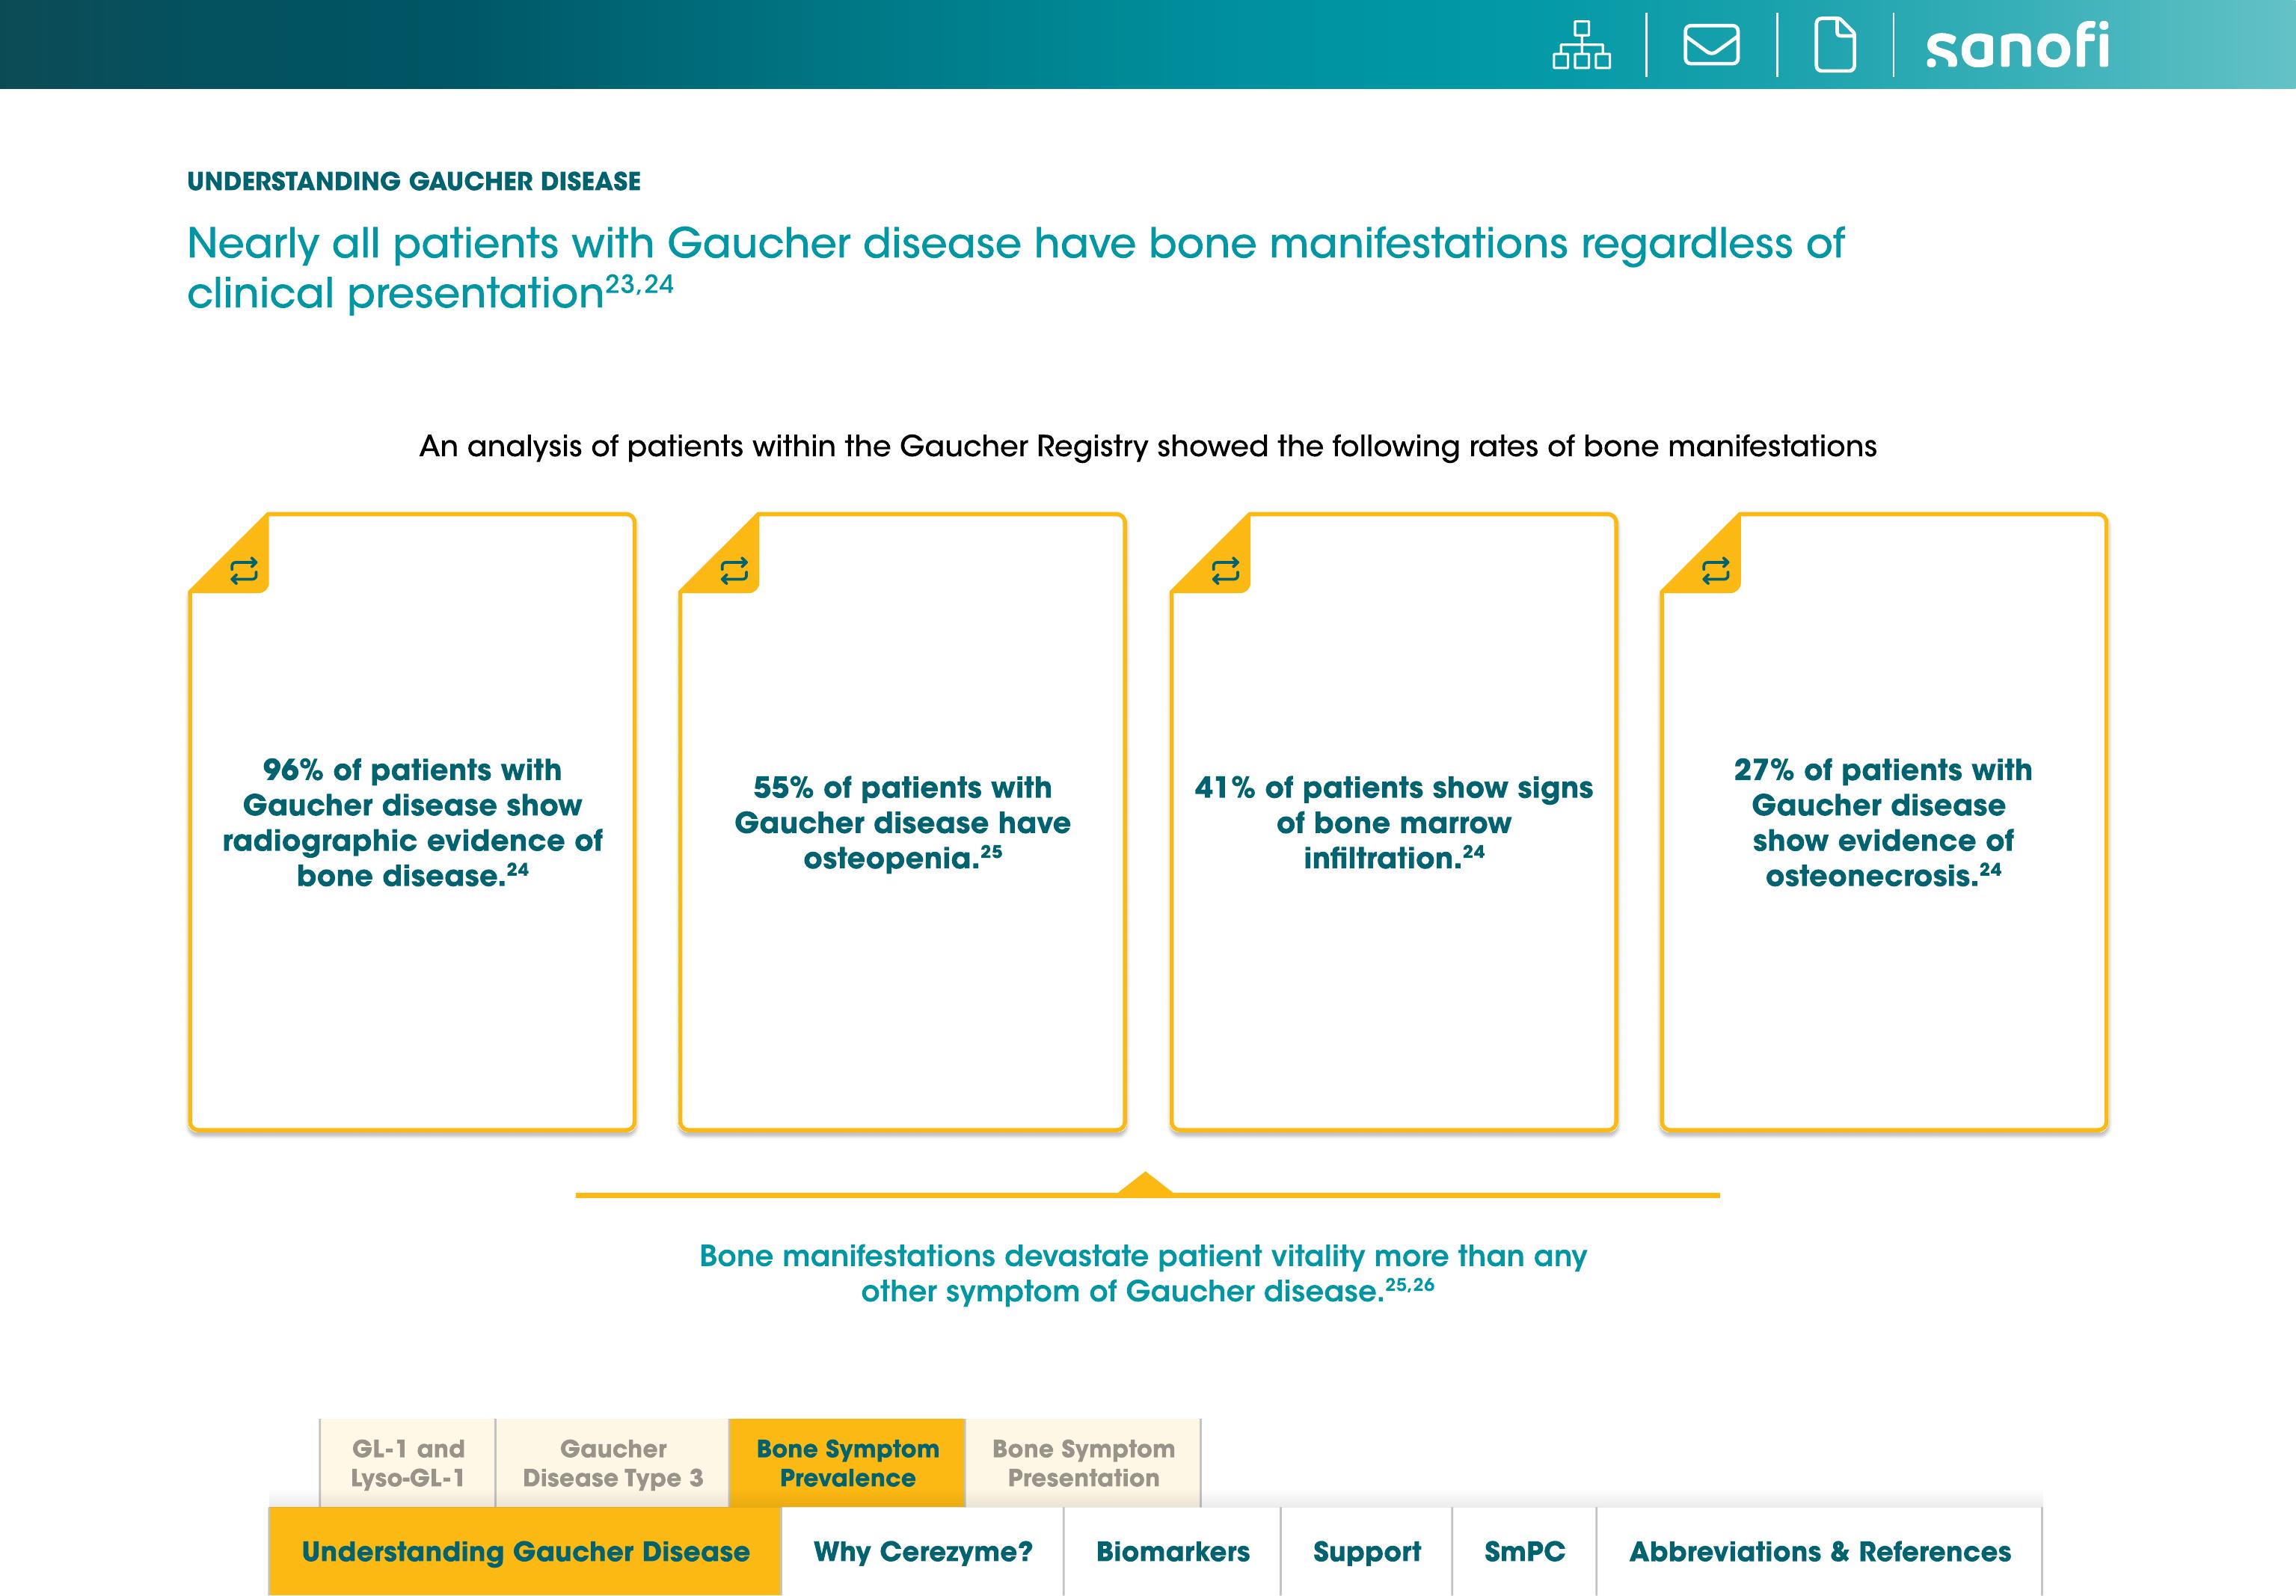
96% of patients with Gaucher disease show radiographic evidence of bone disease.
55% of patients with Gaucher disease have osteopenia.
41% of patients show signs of bone marrow infiltration.
27% of patients with Gaucher disease show evidence of osteonecrosis.
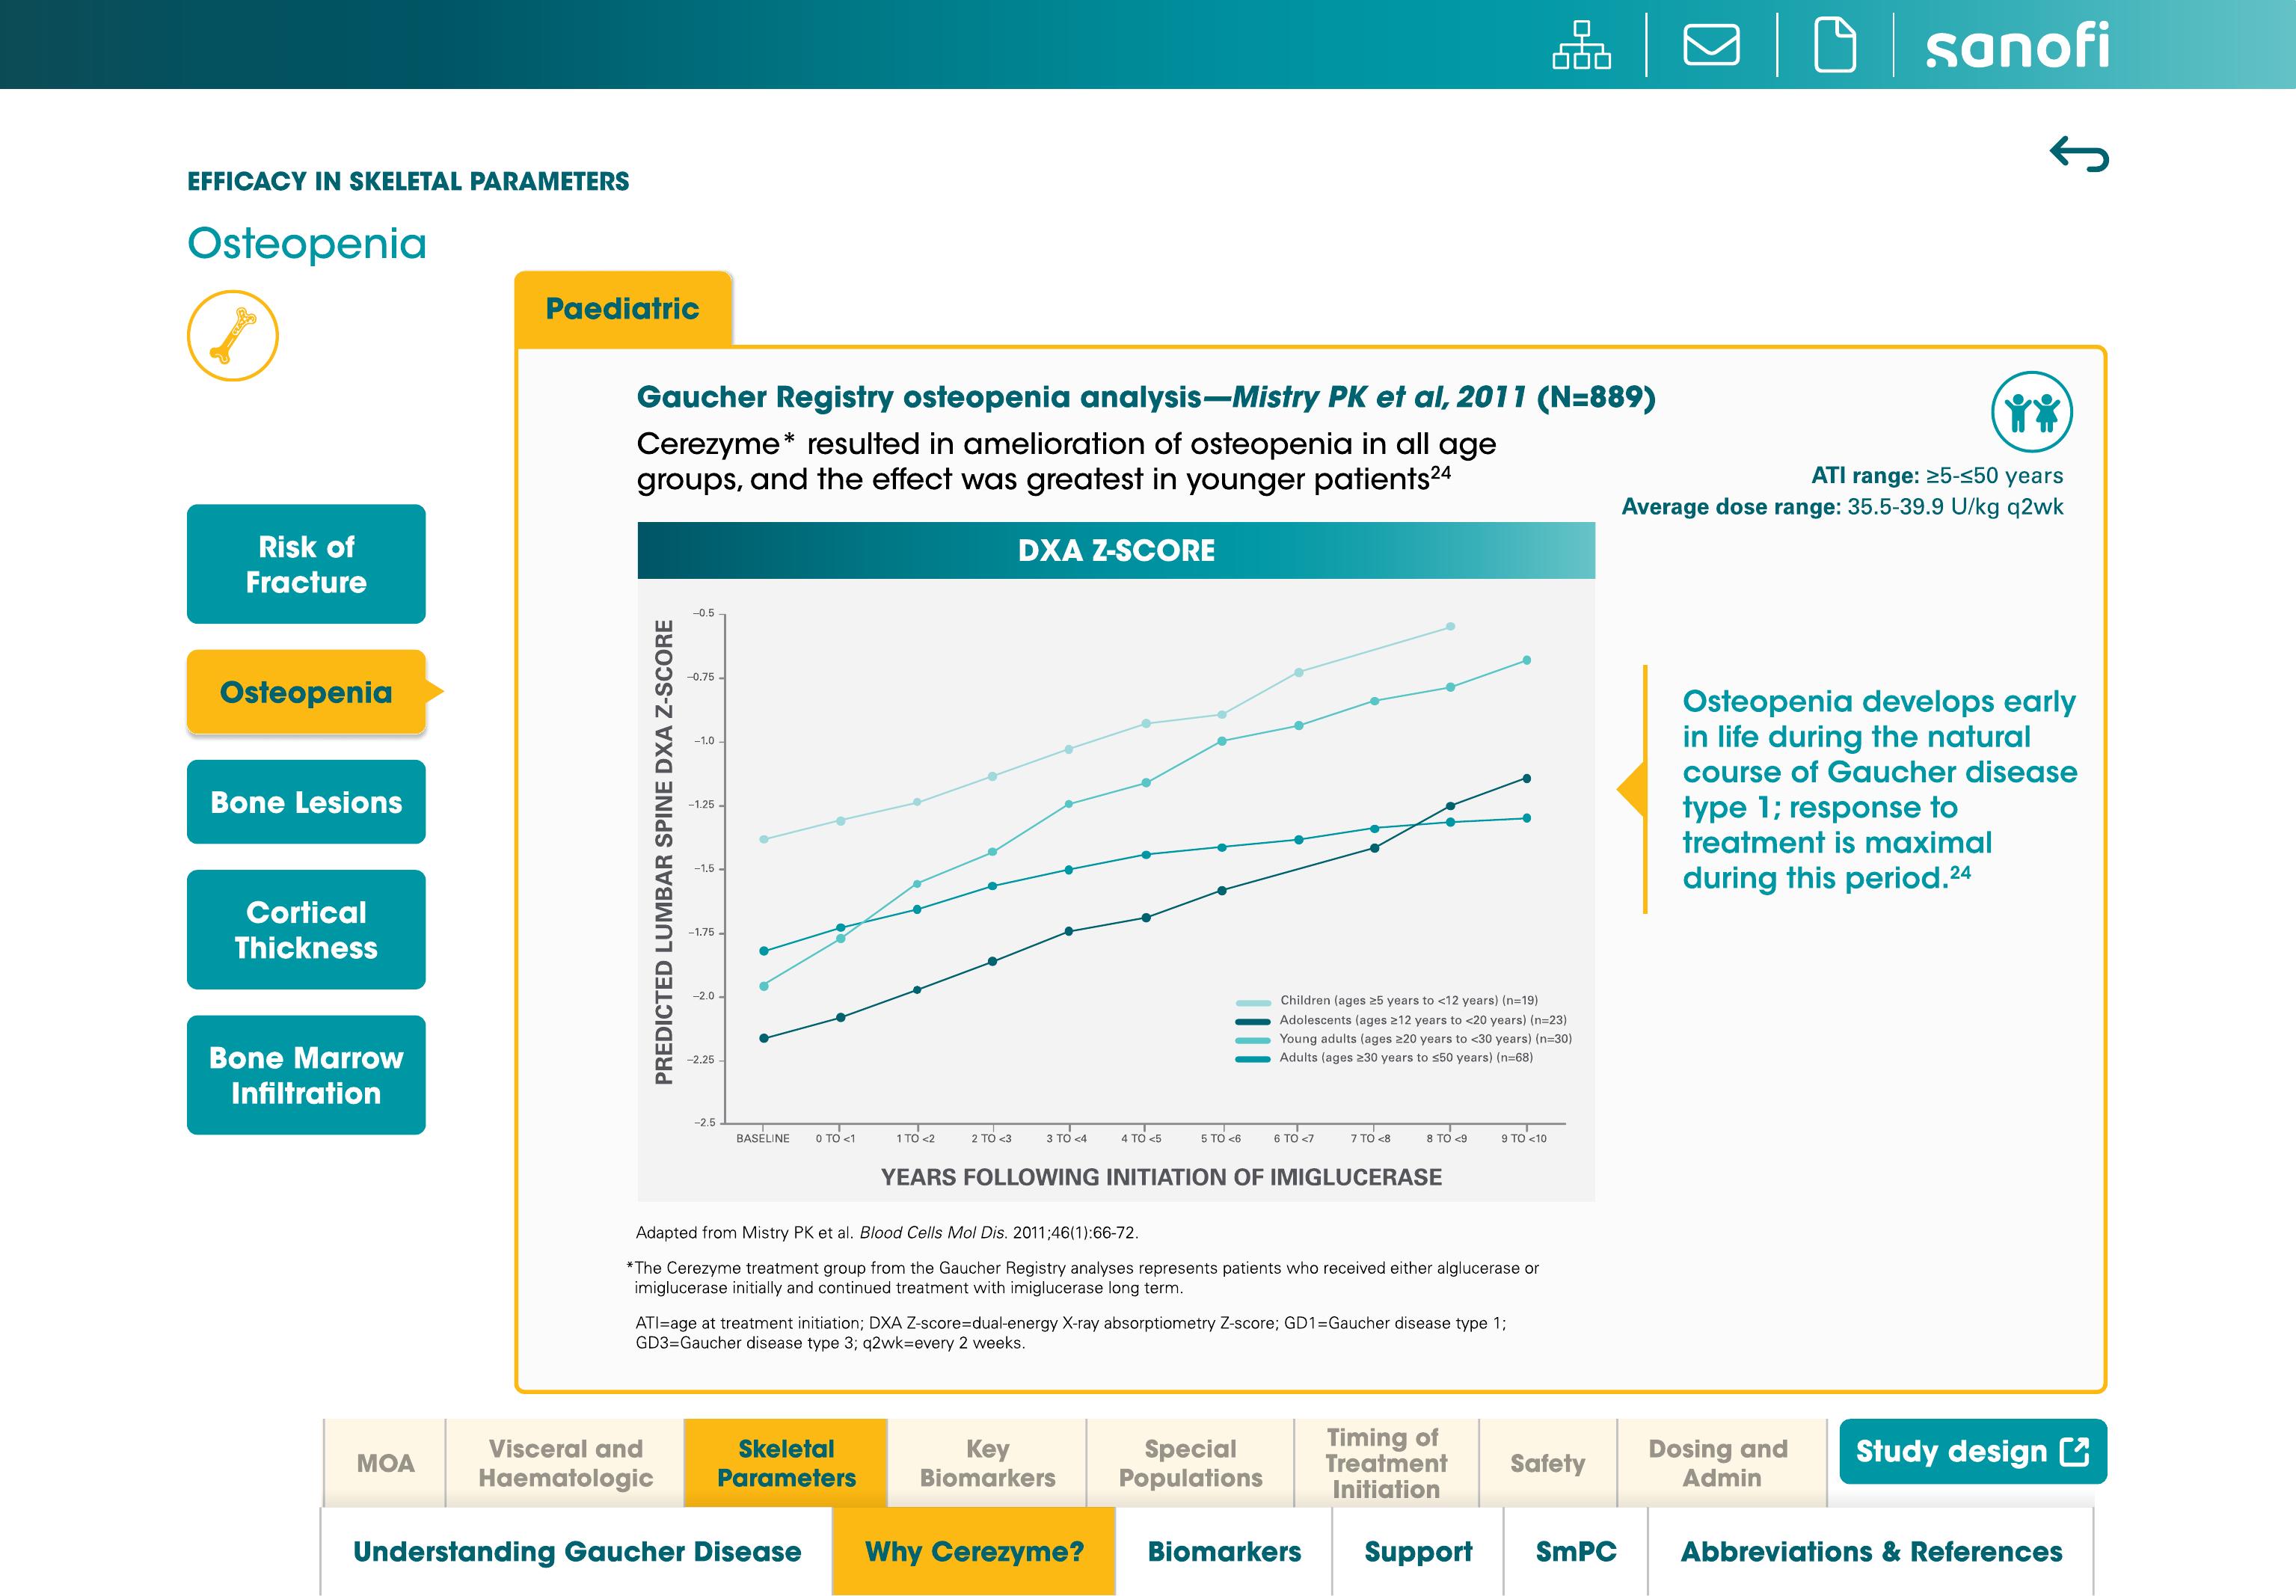
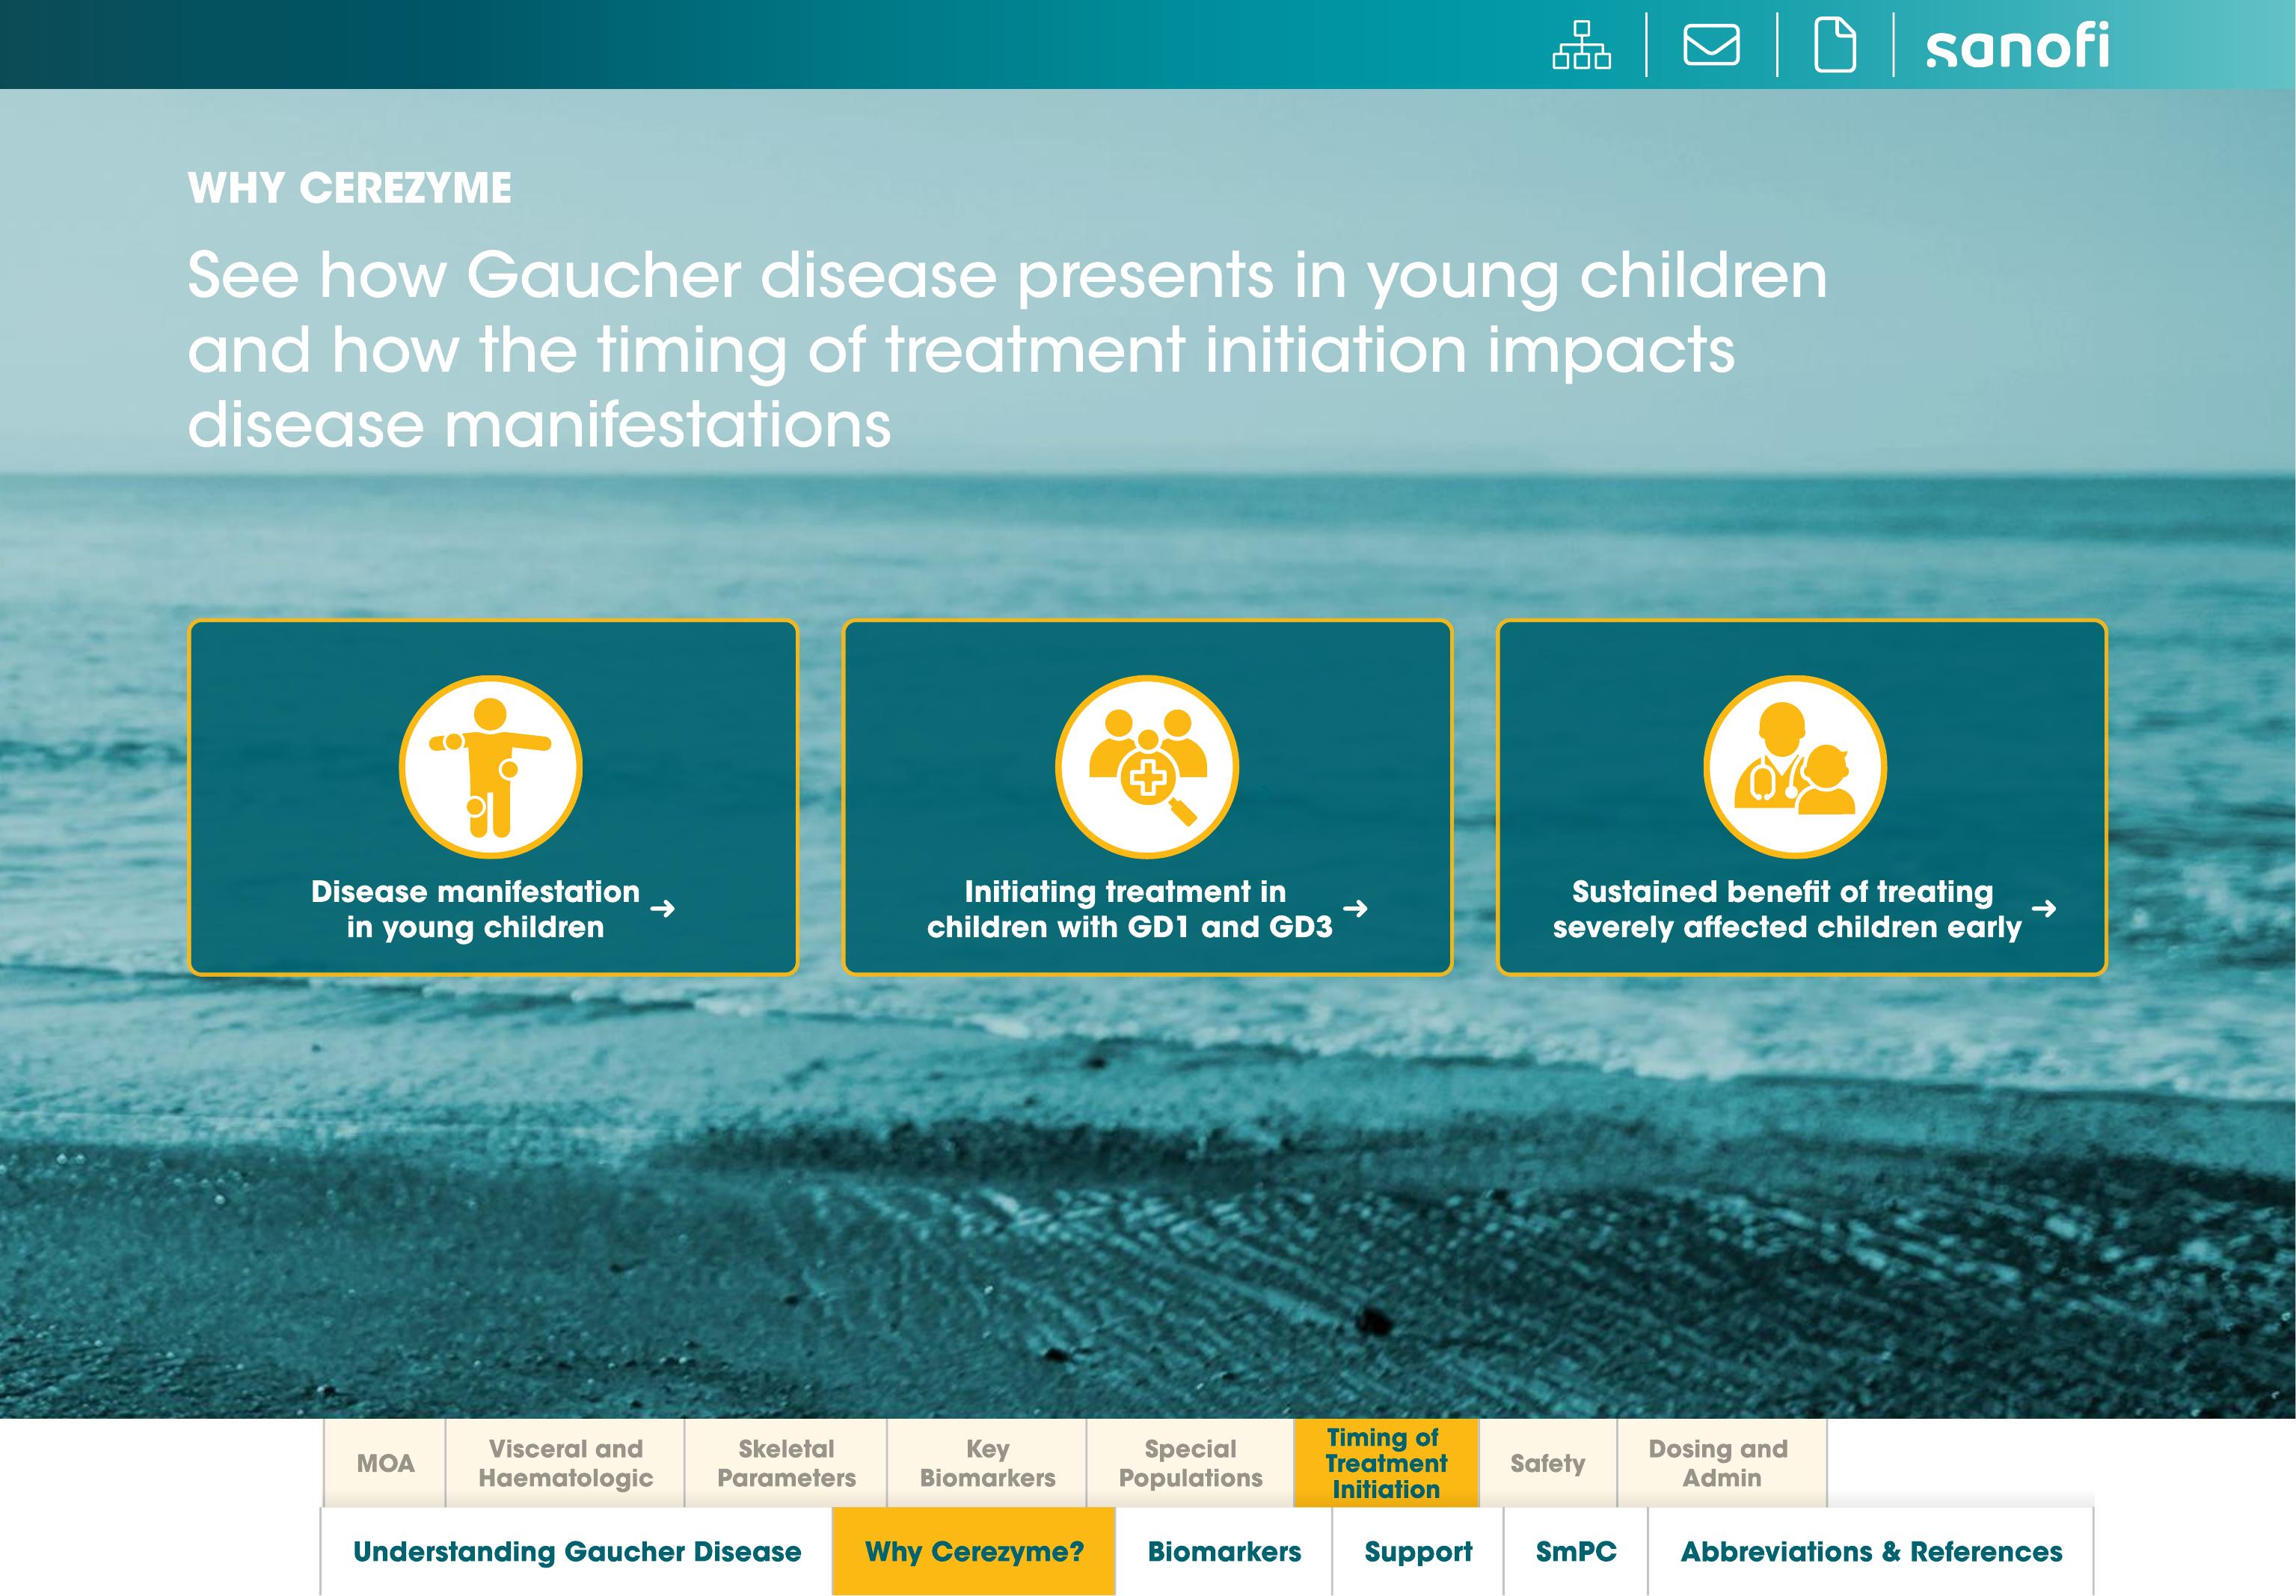
Efficacy data is organized by endpoint first, patient type second. A rep taps an endpoint in the sidebar, then a patient population tab, and the chart underneath updates without leaving the screen. The two screens below are the actual deck; the tab switching itself is a recreation built to show how the pattern works, not the original interaction.